Cardano price dipped 3.5% today, falling below $0.19 as the broader crypto market faces a correction. The token has been struggling to hold above $0.18, and the recent rejection near $0.20 ha
Cardano price dipped 3.5% today, falling below $0.19 as the broader crypto market faces a correction. The token has been struggling to hold above $0.18, and the recent rejection near $0.20 has renewed bearish sentiment.
Analyst Joao Wedson posted something interesting on X that caught my attention. His analysis of leverage pressure data indicates Cardano may be facing another test of its historical bottom region.
Joao Wedson: “You Were Buying in a Region of Extremely High Leverage”
Joao Wedson tweeted: “If you bought Cardano (ADA) around $0.20, you were buying in a region of extremely high leverage. Eight days ago, I warned that investors often decide to buy only when the market is already in the red zone, when leverage, optimism, and risk are already elevated. I would not be surprised to see ADA test its historical bottom region once again.
He added: “This is the crypto market and all its complexities. If you don’t have the right tools, skills, and emotional discipline, you will probably face a very difficult journey.”
ADA Chart Analysis: The Alpha Leverage Pressure Indicator
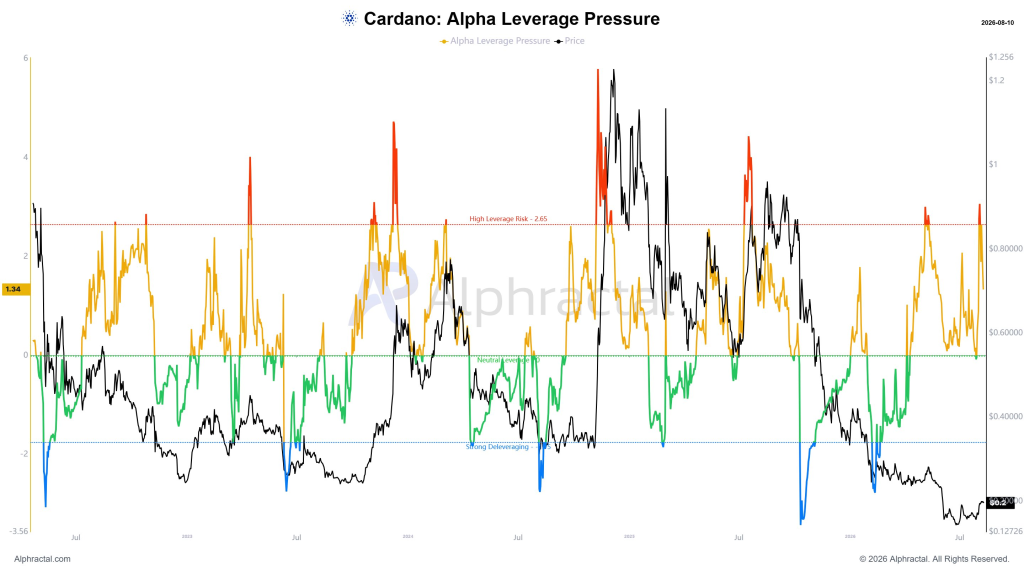
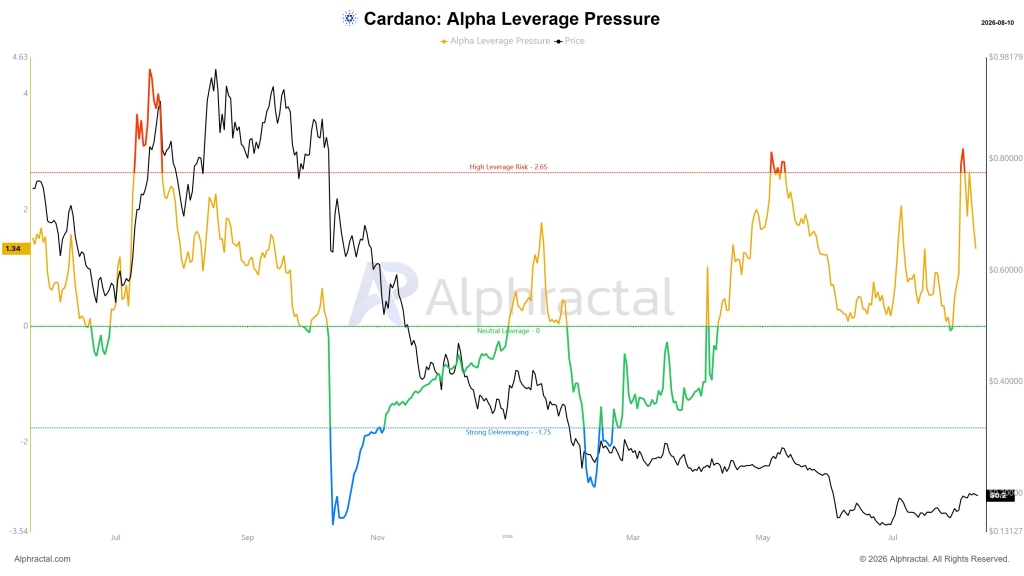
The two charts Wedson shared show the same “Alpha Leverage Pressure” indicator from Alphractal, plotted against ADA price. One image is the full history (2022–2026), the other is a zoomed-in view of roughly the past 14 months.
Source: X/@joao_wedson
The indicator (orange line) appears to be a leverage and positioning metric with three defined zones:
- Red zone (>2.65): “High Leverage Risk”
- Green/neutral (~0): “Neutral Leverage”
- Blue zone (<-1.75): “Strong Deleveraging”
The pattern across both charts is clear: price (black line) tends to make major tops shortly after or during red-zone leverage spikes, and tends to bottom out during or after blue-zone deleveraging flushes. Leverage spikes have historically preceded or coincided with local price tops, and deleveraging flushes have coincided with local bottoms.
 Source: X/@joao_wedson
Checking the Claim Against the Data
Here is where it is worth being precise. The tweet makes a specific factual claim: buying ADA “around $0.20” put you in a region of “extremely high leverage.”
Looking at the current reading on the chart itself, the indicator box shows 1.34 as the latest value. That is:
- Well below the 2.65 “High Leverage Risk” threshold
- Not in the red zone at all
- Sitting in a moderate, rising-from-neutral zone, not an extreme reading
So based on the chart’s own labeled thresholds, the current leverage reading does not match “extremely high” – it is elevated off the lows but nowhere near the red-zone spikes seen earlier in the chart (which hit 4–5+ during actual high-leverage risk periods). If anything, the current setup (price near multi-year lows, leverage rising but still moderate) looks more like the early stages of the pattern than an extreme reading.
On the bottom-retest warning: The broader observation – that this pattern (rising leverage off a low, historically preceding renewed downside) has shown up before – is a fair pattern-based observation to raise as a risk. The charts do show precedent for leverage build-ups near lows preceding further downside in a couple of instances (e.g., late 2022, early 2025).
But it is worth being clear: this is a probabilistic pattern from a relatively small number of historical cycles, not a rule. The current reading of 1.34 does not itself indicate acute danger by the chart’s own scale.
Read also: ChatGPT Predicts the Solana and Cardano Price If Bitcoin Recovers to $80K
Cardano News: Grayscale Withdraws ETF and CTO Departs
Grayscale Investments has voluntarily withdrawn its registration statement for a spot Cardano ETF (GADA) with the U.S. Securities and Exchange Commission. The move, executed via a Form RW filing, was not a rejection by the SEC and leaves the door open for a future refiling.
The withdrawal coincided with the end of a six-month seasoning period for CME-regulated ADA futures, a typical prerequisite for spot ETF approval. Grayscale maintains active applications for other altcoin ETFs but has strategically pulled back on Cardano for now.
Giorgio Zinetti will step down as Chief Technology Officer of the Cardano Foundation on August 31, 2026 , concluding a two-and-a-half-year tenure. The Foundation stated the departure is a planned transition aligned with its 2026 enterprise adoption roadmap, with no immediate successor named.
For the ADA price, the key level to watch is $0.18. A break below that could open the door to a retest of the $0.16 support area. The Grayscale ETF withdrawal is a blow to the institutional narrative, and the CTO departure adds to the uncertainty.
Subscribe to our YouTube channel for daily crypto updates, market insights, and expert analysis.
The post Cardano’s Leverage Pressure Data Is Flashing a Warning Sign Once Again appeared first on CaptainAltcoin.