What to Know: CASHCAT trades near $0.11388 inside a narrowing symmetric triangle, with buyers defending rising support while several EMA levels limit upside. RSI stands at 43.67, showing neut
What to Know:
- CASHCAT trades near $0.11388 inside a narrowing symmetric triangle, with buyers defending rising support while several EMA levels limit upside.
- RSI stands at 43.67, showing neutral momentum, while repeated bearish divergence signals highlight persistent risks surrounding the current consolidation structure.
- Reclaiming $0.12350 could strengthen bullish momentum, while ecosystem attention and renewed listing demand may eventually support higher long-term price targets.
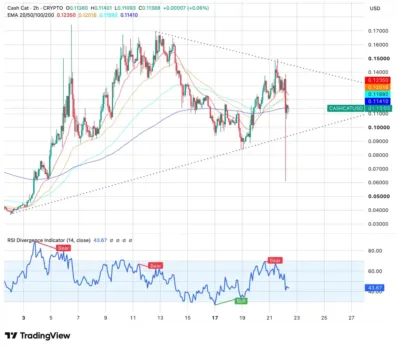
Cash Cat (CASHCAT) is consolidating inside a symmetric triangle following substantial volatility generated by exchange listings and growing social attention. The token recently dropped from approximately $0.145 to a session low of $0.11093 before recovering slightly toward $0.11388.
The Relative Strength Index (RSI) stands at 43.67, placing momentum within neutral territory following its retreat from overbought conditions near 70. However, three bearish divergence signals have appeared since early August, with each preceding a pullback and highlighting continued downside pressure. CASHCAT also remains below its major exponential moving averages, meaning buyers must overcome several technical barriers before establishing a stronger bullish structure.
Also Read: Freysa (FREYSA) Price Prediction 2026–2030: Can FREYSA Hit $0.01?
CASHCAT Triangle Keeps Price Between Major Technical Levels
CASHCAT has traded within a symmetric triangle since early August, with descending resistance extending from the region near $0.17 while ascending support has developed from approximately $0.04. Both trendlines are converging, leaving the token increasingly compressed within a smaller trading range.
Price currently sits within the lower portion of the formation following its decline from approximately $0.145. Immediate resistance begins at the 200-period EMA around $0.11410, followed by the 100-period EMA at $0.11892 and the 50-period EMA at $0.12018.
Source: Tradingview
The strongest nearby EMA resistance stands around $0.12350 at the 20-period EMA. Reclaiming the entire cluster would improve the short-term technical outlook and potentially allow CASHCAT to challenge the triangle’s descending resistance. On the downside, $0.11093 represents immediate support. A decisive breakdown could expose the psychological $0.10000 area before attention shifts toward approximately $0.09000.
RSI Shows Neutral Momentum as Divergence Signals Persist
CASHCAT’s RSI reading of 43.67 indicates that neither buyers nor sellers currently possess overwhelming momentum. The indicator has cooled substantially from levels near 70, reducing the overbought conditions that accompanied previous rallies.
However, bearish divergence remains an important consideration. Three bearish signals have emerged since early August, and each was followed by downward price movement. Another sustained decline in momentum could therefore increase pressure on triangle support. A bullish divergence around August 17 previously aligned with a recovery, showing that momentum signals have influenced recent price swings in both directions.
CASHCAT would need stronger buying activity alongside an RSI recovery above neutral territory to reinforce a potential breakout. Failure to generate that momentum could leave the token vulnerable as the triangle approaches its convergence point.
Cash Cat (CASHCAT) Price Prediction 2026–2030
YearMinimumAverageMaximum2026$0.070$0.120$0.1702027$0.085$0.145$0.2002028$0.100$0.175$0.2302029$0.120$0.205$0.2702030$0.140$0.240$0.300
Price Forecast by Year
2026
Reclaiming the EMA cluster between $0.11410 and $0.12350 could strengthen CASHCAT’s recovery and open a potential move toward $0.17. Conversely, losing triangle support could expose $0.10 and $0.09, particularly if speculative demand weakens.
2027
Stronger market participation and renewed interest surrounding Robinhood Chain could potentially support an advance toward $0.20. CASHCAT would need to establish sustainable support above previous resistance zones for this bullish scenario to develop.
2028
Continued exchange accessibility and stronger speculative demand could allow CASHCAT to challenge approximately $0.23. Such an advance would place the token around its previous all-time-high region, making this area an important long-term resistance zone.
2029
If CASHCAT maintains market interest and develops a broader pattern of higher highs and higher lows, its price could approach approximately $0.27. Significant volatility would remain likely because the token’s valuation continues to depend heavily on market sentiment.
2030
Under a sustained bullish scenario, CASHCAT could potentially reach $0.30 by 2030. From approximately $0.11388, achieving this target would require an increase of roughly 163%, alongside sustained demand and favorable cryptocurrency market conditions.
Derivatives Activity Highlights Elevated Speculation
CASHCAT derivatives volume increased 87.78% to approximately $90.62 million, showing a substantial rise in trading activity. However, open interest dropped 31.26% to $18.66 million as traders reduced existing leveraged positions.
Liquidation data also shows considerable pressure on bullish traders. Approximately $3.71 million in positions were liquidated, with longs accounting for $3.44 million compared with only $277,210 in short liquidations.
The Binance long-to-short ratio stood at 0.9216, leaving positioning relatively balanced despite the recent volatility. Declining open interest alongside rising trading volume suggests traders are actively repositioning rather than aggressively building new leveraged exposure.
Conclusion
Cash Cat remains technically compressed inside a symmetric triangle, with CASHCAT trading near $0.11388 while multiple exponential moving averages create resistance between $0.11410 and $0.12350. Breaking above this cluster could strengthen the case for another recovery.
The RSI at 43.67 reflects neutral momentum, although repeated bearish divergence signals and substantial long liquidations underline the possibility of further weakness. Losing $0.11093 could expose $0.10 and potentially $0.09.
Reaching $0.30 by 2030 remains highly speculative. CASHCAT has no verified third-party smart contract audit, its team remains anonymous, and the project describes itself as having no utility or official Robinhood affiliation. Sustained speculative demand, broader Robinhood Chain activity and favorable market conditions would therefore be essential for the projected bullish scenario.
FAQs
1. Is CASHCAT currently bullish?
CASHCAT remains neutral to bearish in the short term because price trades below its major EMAs while consolidating inside a symmetric triangle.
2. What is the key resistance level for CASHCAT?
Immediate resistance begins at $0.11410, while $0.11892, $0.12018 and particularly the 20-period EMA at $0.12350 create additional barriers.
3. What are the important CASHCAT support levels?
Immediate support stands around the recent $0.11093 session low, followed by the psychological $0.10000 region and deeper support around $0.09000.
4. Can CASHCAT reach $0.30 by 2030?
CASHCAT could potentially reach $0.30 under a sustained bullish scenario, requiring approximately 163% growth from its $0.11388 reference price.
5. What could weaken the CASHCAT price outlook?
A triangle breakdown, falling speculative demand, declining trading activity, additional long liquidations and broader cryptocurrency market weakness could pressure CASHCAT further.
Also Read: Monad (MON) Price Prediction 2026–2030: Can MON Hit $0.10?
The post Cash Cat (CASHCAT) Price Prediction 2026–2030: Can CASHCAT Hit $0.30? appeared first on 36Crypto.