Celestia has had a rough few weeks, and this Celestia price prediction August 2026 comes right as the coin is sitting at a real fork in the road. $TIA is currently trading at $0.3221, up 1.2%
Celestia has had a rough few weeks, and this Celestia price prediction August 2026 comes right as the coin is sitting at a real fork in the road.
$TIA is currently trading at $0.3221, up 1.2% today, but that small green number is hiding a much bigger picture.
Both the daily and weekly charts are pointing to decision zones that could shape where $TIA goes for the rest of the month.
$Celestia Price Today: Live Data and 24-Hour Change
TIA is trading at $0.3221 right now, up 1.2% over the past day, after moving between $0.318 and $0.333.
Market cap sits at $305.901M, outstanding token value is a bit higher at $350.713M, and fully diluted valuation comes in at $378.15M.
Trading volume over the last 24 hours was $17.045M, which is decent but not huge for a coin this size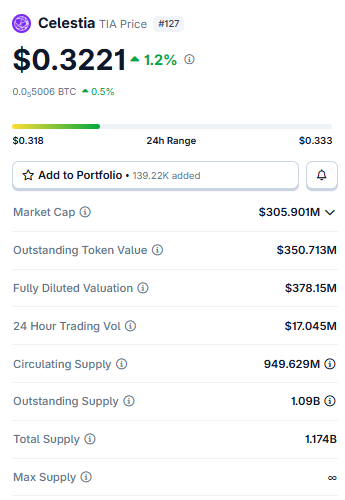
Source: $TIA Market Cap Data Taken From Coingecko, data as of July 31, 2026. Figures may vary slightly across other tracking websites.
Circulating supply is 949.629M TIA, outstanding supply is 1.09B, total supply is 1.174B, and max supply is uncapped. That last part matters.
$Celestia doesn't have a hard ceiling on supply, so ongoing issuance is something to keep in mind for any longer-term Celestia price prediction august 2026, not just this month's chart levels.
Technical Analysis: Key Support and Resistance Levels (Celestia)
$Celestia Daily Chart: Ascending Channel
The daily chart shows $TIA climbing slowly inside an ascending channel for a while now. Though the most recent running candle actually pulled back a bit, it opened at 0.3278, touched a high of 0.3299, dropped to a low of 0.3213, and is running at 0.3222.
The price is currently sitting right near the bottom edge of that channel.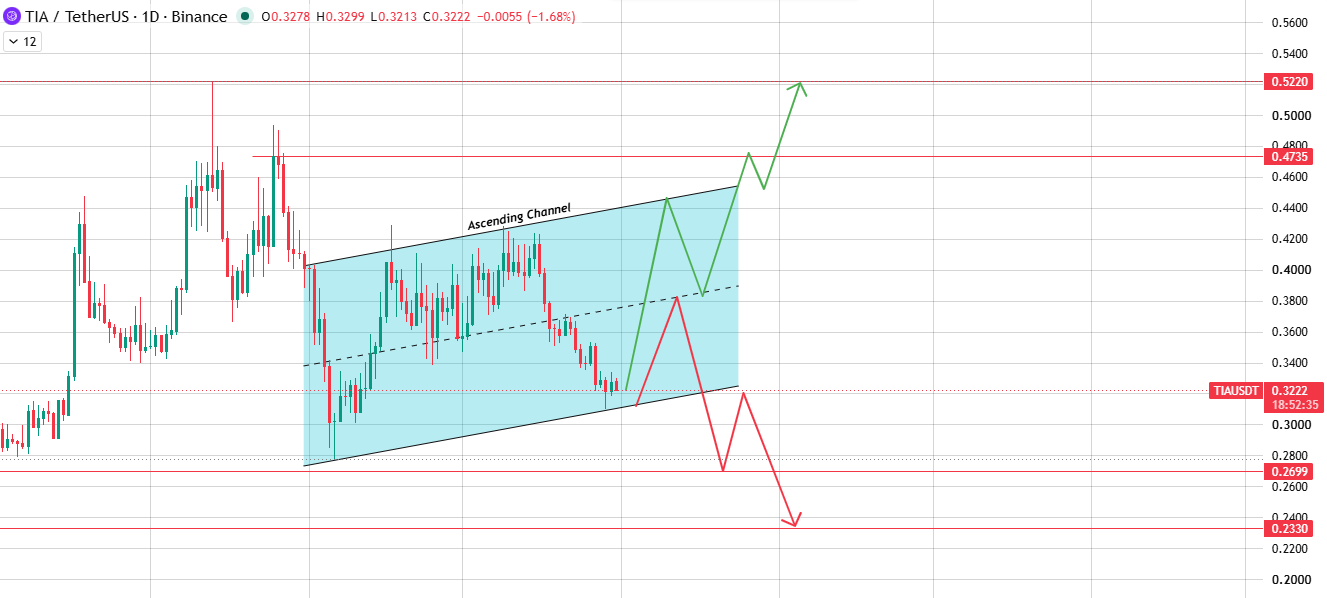
Source: Chart Taken From TradingView.
If buyers step back in here with decent volume and break the structure, resistance overhead sits at $0.4735 first, and clearing that opens the door to $0.5220.
But if this pullback keeps going and the channel actually breaks down, the more likely path is a drop to support at $0.2699, and if that fails too, $0.2330 becomes the next level to watch.
$Celestia Weekly Chart: Triangle at the Apex
Zoom out to the weekly chart, and TIA has been squeezed inside a descending triangle for weeks, with the price now sitting almost near at the bottom of it.
The last weekly candle opened at 0.3506, ran up to 0.3523, fell hard to 0.3099, and is running at 0.3230.
This is about as clean a decision point as it gets.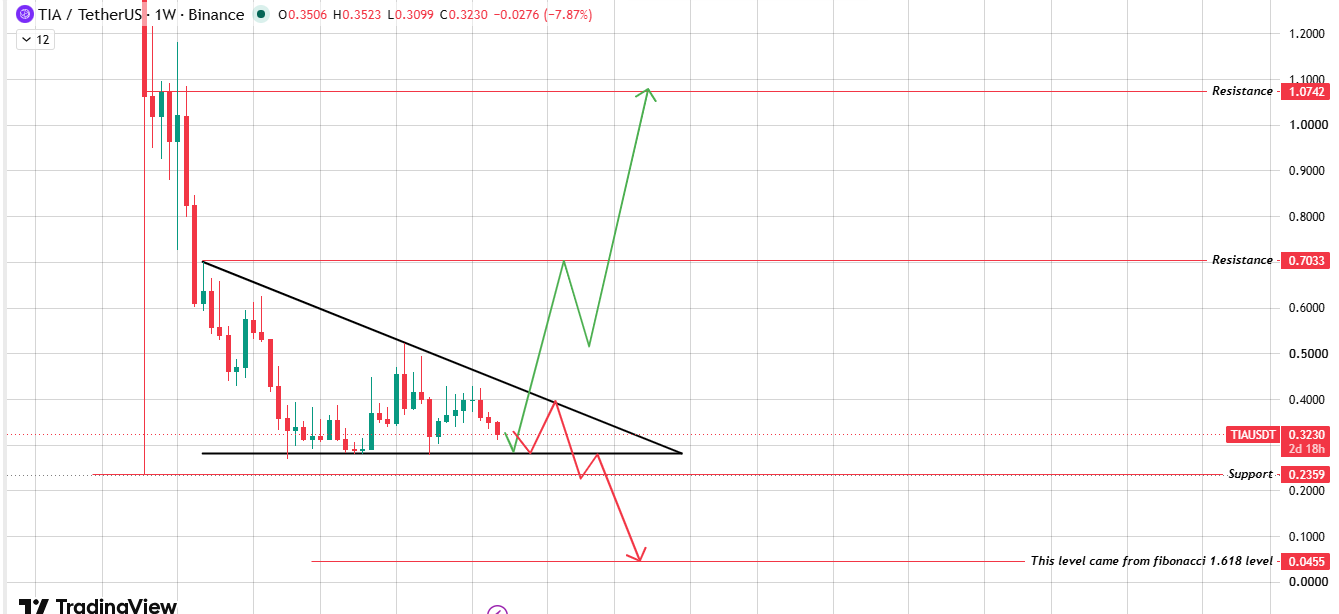
Source: Chart Taken From TradingView.
If volume shows up and $TIA breaks upward out of this triangle, the first big target is $0.7033, and things could realistically stretch toward $1.0742 if the move has real strength behind it.
Break down out of the triangle instead, and support sits at $0.2359 first, with the chart's own Fibonacci extension pointing all the way down to $0.0455 in a genuinely bad scenario.
Celestia Price Prediction August 2026: Bull, Base, and Bear Cases
Here's the honest read on this Celestia price prediction August 2026.
$TIA is sitting right where two different timeframes are both asking the same question at once. The daily chart has it inside a rising channel.
The weekly chart has it at the tip of a descending triangle, right at the apex.
ScenarioTargetInvalidation Level
BullDaily:
$0.4735 – $0.5220 Weekly:
$0.7033 – $1.0742Rejection at daily resistance; price slips back into the channel.
Base$0.2699 – $0.4735 (Range-Bound)Confirmed close outside either boundary.
BearDaily:
$0.2699 – $0.2330 Weekly:
$0.2359 – $0.0455Breakdown below the ascending channel and the weekly triangle.
For the bullish case to actually play out, $TIA needs real buying pressure to push through daily resistance while the weekly triangle breaks upward at the same time.
Get that, and $0.4735 is the first target, then $0.5220, with the weekly chart's much bigger levels near $0.7033 and $1.0742 opening up further out if momentum really builds.
The base case is nothing exciting; $TIA just keeps bouncing between support and resistance without really deciding anything.
August 2026 Catalysts That Could Move $Celestia
Keep an eye on how Celestia's modular blockchain ecosystem grows this month, along with any new rollups or projects choosing to build on it.
Those are the things that actually matter for TIA specifically.
Outside of that, whether price can hold the ascending channel and how the weekly triangle resolves will probably drive sentiment more than anything else, alongside the usual mood swings of the broader crypto market.
What Analysts Are Forecasting (Celestia)
So, will Celestia go up in August 2026? That really comes down to whether TIA can hold its daily channel and break its weekly triangle upward at the same time. If both line up together, that's a genuinely strong signal for the bulls.
If either one fails, TIA could easily slip back into the range it's been stuck in, or worse. None of this is guaranteed; it's just what the current charts are pointing toward.
Celestia Long-Term Outlook: 2027 to 2030
If TIA clears both the daily and weekly resistance zones this year, a longer climb toward $0.7033 and maybe even $1.0742 looks like a fair stretch target across 2027 and 2028.
What Celestia is actually worth by 2030 will depend a lot more on real adoption of its modular data-availability layer than on any single chart pattern, though the current setup gives a reasonable place to start thinking about it.
Risks That Could Invalidate This Forecast (Celestia)
The clearest risk here is TIA failing to hold its daily channel and breaking down through it instead.
That opens the path to support at $0.2699, then $0.2330, with the weekly triangle breakdown pointing toward $0.2306 and eventually the much deeper $0.0455 level in a worst-case scenario.
Is Celestia oversold right now? At these prices, maybe, but oversold coins can absolutely keep falling if the wider market turns bearish.
How to Buy and Store Celestia Safely
TIA is available on most major exchanges, usually paired against USDT or USD.
Since supply is uncapped, it's worth keeping an eye on ongoing issuance alongside the technical levels above.
Hardware wallets are the safer bet for larger holdings, while exchange wallets are fine for smaller amounts you're trading actively.
Disclaimer: This celestia price prediction is for informational and educational purposes only and should not be considered financial or investment advice. Cryptocurrency markets are highly volatile, and prices can change rapidly. Always conduct your own research and consult a qualified financial advisor before making any investment decisions.