What to Know TIA remains below the Bollinger mid-band as bearish momentum persists. RSI rebounded from oversold levels, signaling weakening selling pressure. Long-term projections suggest TIA
What to Know
- TIA remains below the Bollinger mid-band as bearish momentum persists.
- RSI rebounded from oversold levels, signaling weakening selling pressure.
- Long-term projections suggest TIA could recover toward $1 and beyond.
Celestia (TIA) remains under significant bearish pressure after a prolonged correction pushed the token toward multi-month lows. The latest TradingView data shows TIA trading near $0.313 on Coinbase, well below the Bollinger Band midline and far from the highs recorded during May.
Momentum indicators suggest sellers still dominate the broader trend, but conditions may be stabilizing. The Relative Strength Index (RSI) has rebounded slightly from oversold territory, indicating that downward momentum is losing strength as buyers attempt to defend support around current levels.
The latest recovery candle has helped TIA bounce from the lower Bollinger Band support zone. However, the token remains below key resistance levels, meaning bulls still need to reclaim important technical areas before a sustained recovery can develop.
Also Read: Flare (FLR) Price Prediction 2026–2030: Can FLR Hit $0.02 Soon?
Market Structure and Price Action
TIA experienced strong bullish momentum throughout May, rallying toward the $0.49 region before encountering heavy resistance. Sellers eventually regained control, triggering a sharp decline that erased much of the previous advance.
Several consecutive bearish candles pushed the token below the Bollinger mid-band near $0.394, shifting market sentiment in favor of sellers. The correction accelerated during early June as traders reduced risk exposure amid broader cryptocurrency market weakness.
The decline eventually drove TIA toward the lower Bollinger Band around $0.297. Buyers stepped in near this support level, producing a modest rebound that lifted prices back above $0.31. Despite this recovery attempt, TIA continues to trade beneath the Bollinger mid-band, confirming that the short-term trend remains bearish.
Technical Analysis
Technically, TIA faces significant resistance while trading below the Bollinger mid-band at approximately $0.394. This level now serves as the most important hurdle for buyers seeking to reverse the current downtrend. The lower Bollinger Band near $0.297 remains the nearest support level. A breakdown below this area could expose TIA to deeper losses and potentially trigger another wave of selling pressure.
Meanwhile, the upper Bollinger Band sits near $0.491 and represents the next major resistance zone if buyers successfully reclaim the mid-band resistance. The RSI currently stands at 34.46 while its moving average is near 45.40. This reading places TIA close to oversold territory and suggests bearish momentum may be approaching exhaustion. Historically, RSI readings near 30 often precede relief rallies, especially when accompanied by strong support reactions.
The immediate resistance level remains at $0.394. A successful breakout above this zone could shift momentum back toward buyers and open the path toward $0.491. On the downside, support remains firmly positioned around $0.297. Maintaining this level will be critical for preventing further deterioration in market structure.
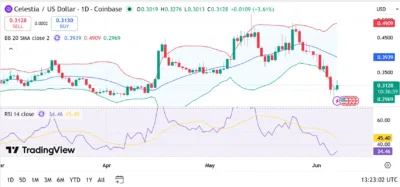
Source:Tradingview
Celestia (TIA) Price Predictions (2026–2030)
YearMinimum PriceAverage PriceMaximum Price2026$0.28$0.45$0.702027$0.35$0.65$0.952028$0.50$0.90$1.252029$0.70$1.20$1.702030$0.90$1.60$2.20
Yearly Insights
2026
TIA could remain volatile while attempting to establish a stronger base above the $0.30 support region and gradually recover toward $0.70.
2027
Improving ecosystem adoption and healthier market sentiment could support a move toward the $0.95 area.
2028
A broader cryptocurrency bull cycle may help TIA reclaim the $1 milestone and strengthen long-term momentum.
2029
Continued growth across modular blockchain infrastructure and developer activity could drive further upside.
2030
Favorable market conditions and increasing network adoption could allow TIA to challenge the $2 region during an extended bull market.
Conclusion
TIA is attempting to stabilize after a sharp correction pushed the token close to oversold territory. While the broader trend remains bearish, recent RSI behavior suggests selling pressure may be beginning to fade.
The $0.297 support zone remains the most important level to monitor in the near term. As long as buyers continue defending this area, TIA could gradually build the foundation for a larger recovery.
A decisive breakout above the Bollinger mid-band at $0.394 would significantly improve the technical outlook and increase the probability of a move toward $0.491. Although risks remain elevated, the long-term outlook favors gradual appreciation if adoption continues growing and broader market conditions improve.
FAQs
The nearest support level is located around $0.297 near the lower Bollinger Band.
2. What is TIA’s main resistance level?
Immediate resistance sits near $0.394 at the Bollinger mid-band.
3. What does the RSI indicate?
The RSI reading of 34.46 shows TIA remains near oversold territory, suggesting bearish momentum may be weakening.
4. Why is the Bollinger mid-band important?
The Bollinger mid-band often acts as dynamic resistance and helps determine the direction of the prevailing trend.
5. Can TIA reach $1 again?
Long-term projections suggest TIA could reclaim $1 if market sentiment improves and buyers successfully defend key support levels.
Also Read: Nexo (NEXO) Price Prediction 2026–2030: Can NEXO Hit $1.8 Soon?
The post Celestia (TIA) Price Prediction 2026–2030: Can TIA Hit $1 Soon? appeared first on 36Crypto.