What to Know CGPT rebounded from recent lows and reclaimed the Bollinger mid-band. RSI crossed above its signal line, indicating improving momentum. Long-term projections suggest CGPT could t
What to Know
- CGPT rebounded from recent lows and reclaimed the Bollinger mid-band.
- RSI crossed above its signal line, indicating improving momentum.
- Long-term projections suggest CGPT could target $0.10 and beyond.
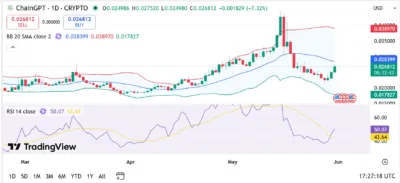
ChainGPT (CGPT) is showing renewed signs of strength after recovering from a sharp correction that followed its recent rally toward the $0.04 region. The latest daily chart reveals buyers stepping back into the market as the token climbed toward $0.027, recovering from a prolonged decline that pushed prices closer to the lower Bollinger Band support zone.
At the same time, momentum indicators are beginning to improve. The Relative Strength Index (RSI) has rebounded to 50.07 and moved above its signal line at 43.64, suggesting bullish momentum is gradually returning. While the asset remains below its recent peak, the latest recovery indicates that buyers are attempting to regain control of the broader trend.
Also Read: SuperVerse (SUPER) Price Prediction 2026–2030: Can SUPERHit $1 Soon?
Market Structure and Price Action
CGPT experienced a strong rally throughout May, eventually reaching a local high near $0.04 before sellers emerged and triggered a significant pullback. The correction pushed the token below the Bollinger mid-band and drove price toward the lower support region near $0.018.
However, recent trading sessions have shown signs of stabilization. Buyers defended the lower Bollinger Band successfully and helped drive the token back above the mid-band level at approximately $0.028. This recovery suggests selling pressure may be weakening as traders begin accumulating near support zones.
Moreover, the latest daily candle posted a gain of more than 7%, highlighting increasing demand after several sessions of consolidation. The ability to maintain this recovery could determine whether CGPT attempts another move toward its previous highs.
Technical Analysis
Technically, CGPT is attempting to rebuild bullish momentum after its recent correction phase. The Bollinger Bands currently show the upper band near $0.0389, the middle band around $0.0284, and the lower band close to $0.0178. The RSI reading of 50.07 indicates neutral-to-bullish conditions. More importantly, the RSI has crossed above its moving average, a signal that often precedes stronger upward momentum when accompanied by rising volume and improving market sentiment.
Immediate resistance is located near $0.0284, which aligns with the Bollinger mid-band. A successful breakout above this level could open the path toward $0.035 and eventually the recent high near $0.04.
On the upside, traders will closely monitor resistance near $0.0284 and $0.039. Breaking above these levels would strengthen the bullish outlook and potentially attract additional buying interest. On the downside, immediate support remains near $0.022, while stronger structural support sits around the lower Bollinger Band at $0.0178. Holding above these levels would help preserve the developing recovery structure.
Source: Tradingview
ChainGPT (CGPT) Price Predictions (2026–2030)
YearMinimum PriceAverage PriceMaximum Price2026$0.025$0.045$0.0752027$0.040$0.065$0.1002028$0.060$0.095$0.1402029$0.090$0.160$0.2202030$0.130$0.250$0.350
Yearly Insights
2026
CGPT could benefit from improving AI-related market sentiment and stabilize above $0.045.
2027
Growing adoption of AI-powered blockchain tools may help the token approach the $0.10 level.
2028
Continued ecosystem development and stronger user activity could support further upside expansion.
2029
Broader crypto market growth may drive increased demand for AI-focused blockchain projects.
2030
Sustained adoption and favorable market conditions could allow CGPT to challenge the $0.35 region.
Conclusion
ChainGPT is showing early signs of recovery after a sharp correction from its recent highs. The rebound from lower Bollinger Band support, combined with an improving RSI structure, suggests momentum is gradually shifting back in favor of buyers.
While resistance near $0.028 and $0.039 remains important, the broader outlook remains constructive as long as CGPT holds above key support levels. A decisive breakout above current resistance zones would significantly improve the probability of a move toward higher long-term targets, including the psychological $0.10 milestone.
FAQs
The nearest resistance is located around $0.0284, with stronger resistance near $0.039.
2. What support level is most important?
Key support currently sits near $0.0178, which aligns with the lower Bollinger Band.
3. What does the RSI indicate?
The RSI at 50.07 suggests momentum is improving and moving toward bullish territory.
4. Why are Bollinger Bands important for CGPT?
They help identify volatility, support zones, and potential breakout levels.
5. Can CGPT reach $0.10?
If adoption continues growing and bullish market conditions persist, CGPT could potentially reach $0.10 during the next market cycle.\
Also Read: Synthetix (SNX) Price Prediction 2026–2030: Can SNX Hit $1 Soon?
The post ChainGPT (CGPT) Price Prediction 2026–2030: Can CGPT Hit $0.10 Soon? appeared first on 36Crypto.