Chainlink Closes Weekly Above $13.70 as Analysts Eye $15 Resistance
LINK closed at $14.04, its highest weekly close since November 2025 and moving above the $13.70 resistance. Analysts identify $15 as the next major resistance, while $14.50 remains a nearby h
A
AnonymousCryptoCompass newsroom
September 28, 2026
2 min read
NEWS
CryptoCompass editorial visual for altcoins coverage.
LINK closed at $14.04, its highest weekly close since November 2025 and moving above the $13.70 resistance.
Analysts identify $15 as the next major resistance, while $14.50 remains a nearby hurdle after the recent rally.
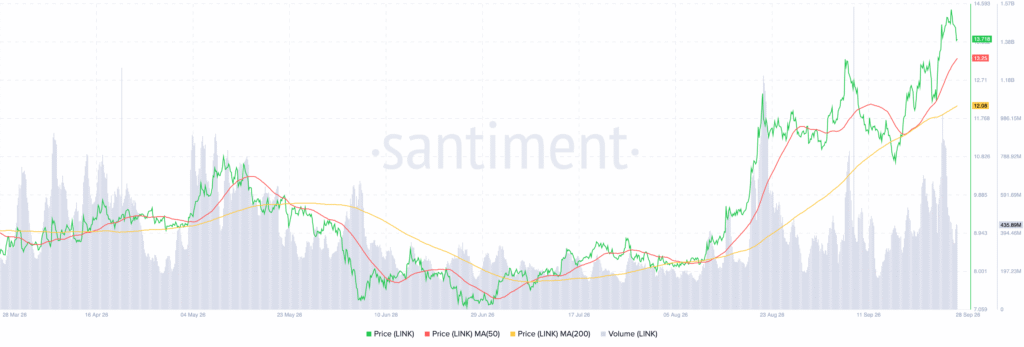
LINK trades above its 50-day and 200-day moving averages at $13.25 and $12.08, respectively.
Chainlink closed its latest weekly session at $14.04, above the $13.70 resistance level, according to analyst Quinten. Michael van de Poppe highlighted LINK as an older cryptocurrency that could perform better this cycle. The move followed a rise toward $14.50, while trading remained above key moving averages.
LINK Breaks Above Key Weekly Resistance
Quinten said the $14.04 weekly close marked LINK’s highest weekly close since November 2025. The close also moved above the Aug. 30 weekly close and formed a higher high. However, Quinten pointed to resistance around $15, which also represents the biggest monthly resistance level.
He said clearing that area could precede a stronger move. The latest chart places LINK near $13.718 after a pullback from its peak around $14.50. The retreat followed an advance that began after the token moved above $10 in August.
Van de Poppe Highlights LINK Ecosystem Growth
Michael van de Poppe identified LINK among older cryptocurrencies that could perform better than during the previous cycle. He pointed to continued innovation and growth across the Chainlink ecosystem.
He also described an S-curve pattern developing for LINK. Meanwhile, the token’s price history shows a recovery from roughly $7.06 in June. LINK traded within a broad range from late March through early June before the recovery gained pace. Momentum accelerated in August after the breakout above $10.
Moving Averages Define Nearby Support
The 50-day moving average is at $13.25, while the 200-day moving average is at $12.08. LINK remains above both levels, with $13.25 as the nearer support area.
If LINK falls below $13.25, the $12.08 moving average becomes the next support level shown. On the upside, $14.50 remains nearby resistance, while $14.59 marks the chart’s upper displayed boundary.
Trading activity also increased during the August breakout and September advances. The latest displayed volume reading is at approximately 435.89 million LINK.
The current price action follows the August move above $10 and the subsequent rise toward $14.50. Quinten specifically identified $15 as the next major resistance area.
Crypto exchange Bitget is resuming withdrawals after a security breach affecting nearly $388 million in assets, as the attacker continues moving stolen crypto through THORChain. Bitget said i
Bitget Hack Update: $387M Theft, THORChain Dispute and Withdrawal Date This Bitget hack update brings new answers. On September 28, Bitget CEO Gracy Chen explained how attackers took roughly
Key Insights: Ethereum price prediction centers on a breakout above the $2,800 resistance. Bitfinex ETH shorts climbed to unusually high levels in September. U.S. spot Ether ETFs recorded fou


 Source: