Key Highlights LINK is trading at $12.25 — down 2.76% in 24 hours — just $0.25 above the critical $12 neckline Analyst @alicharts flags a head-and-shoulders pattern on LINK's 4H chart; a clos
Key Highlights
LINK is trading at $12.25 — down 2.76% in 24 hours — just $0.25 above the critical $12 neckline
Analyst @alicharts flags a head-and-shoulders pattern on LINK's 4H chart; a close below $12 triggers ~30% correction
First target: $10.00 (−18.4%); main pattern target: $8.50 (−30.6%) after possible consolidation
Pattern remains unconfirmed until a sustained 4H close below $12 — intraday wicks do not count
Chainlink is trading at $12.25 — down 2.76% in the past 24 hours — and a bearish technical pattern is forming that could accelerate the decline sharply if one level fails to hold.
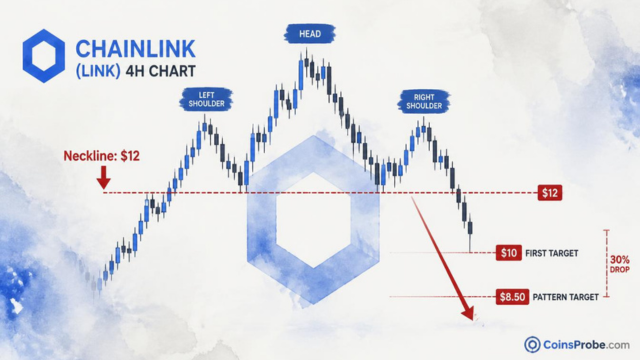
Crypto analyst Ali Martinez (@alicharts) identified a head-and-shoulders pattern developing on LINK’s 4-hour chart, flagging $12 as the critical support level that separates a continuation from a confirmed breakdown. His post, published on October 17, 2026, states directly: a sustained close below $12 could trigger a roughly 30% correction, with $10 as the first stop and $8.50 as the main pattern target.
The head-and-shoulders is one of the most documented reversal patterns in technical analysis. It forms across three peaks: a left shoulder, a higher central peak (the head), and a right shoulder at roughly the same level as the left. The neckline — the support connecting the troughs between the shoulders — is the confirmation trigger. A sustained close below the neckline confirms the pattern and activates a measured-move target equal to the distance from the head to the neckline, projected downward.

LINK 4H Chart | Source: @alicharts (X)
In LINK’s current 4-hour structure, @alicharts identifies $12 as that neckline. At $12.25, LINK is trading just $0.25 above the level that would confirm the pattern. The proximity is not coincidental — the 2.76% intraday decline is pressing directly into this zone. A single sustained 4-hour close below $12 would be the trigger.
This setup is consistent with the broader bearish technical picture that has been flagged across altcoins in recent sessions. CoinsProbe previously covered simultaneous bearish setups across LINK, ADA, and SOL in LINK, ADA, and SOL Flash Bearish Setups — Analyst Flags Downside Targets.
@alicharts outlines a two-stage correction scenario if the $12 neckline fails:
Stage 1 — $10.00: The initial target following a confirmed breakdown. This represents an 18.4% decline from the current price of $12.25.
Stage 2 — $8.50: The main measured-move target for the full head-and-shoulders pattern. From the current price, this represents a 30.6% decline — consistent with the analyst’s stated “roughly 30% correction.”
The analyst notes that a consolidation phase is possible between $10 and the final target at $8.50, meaning the move may not be immediate and linear. Markets often pause at round-number levels before the larger pattern resolves.
It is worth noting that on-chain data has shown notable whale accumulation in LINK in recent weeks — CoinsProbe reported that Chainlink whales added 2.5M LINK in 10 days alongside accelerating network growth. That structural demand picture does not override the technical pattern, but it does contextualize the risk: a break below $12 would mean distribution is overwhelming the accumulation trend identified on-chain.
The head-and-shoulders pattern is only confirmed on a sustained close below $12 — not an intraday wick, not a brief dip. A bounce from $12 that holds on a 4-hour closing basis leaves the pattern unconfirmed and LINK in a range. Bulls need to defend $12 on a closing basis and reclaim price territory above the right shoulder to structurally negate the formation.
At $12.25, LINK has less than 2.1% of buffer before the neckline is tested on a closing basis. Given that 24-hour volume stands at $252.15 million against a market cap of $9.40 billion, there is sufficient liquidity for a decisive move in either direction without abnormal slippage.
Bullish Scenario
LINK holds $12 on a sustained 4-hour closing basis and reclaims momentum above the right shoulder. The head-and-shoulders pattern fails to confirm. Recovery toward the $14–$15 range becomes the path of least resistance as the bearish setup is invalidated.
Bearish Scenario
A sustained 4-hour close below $12 confirms the head-and-shoulders pattern. The first measured target is $10.00 — an 18.4% decline from current levels. A consolidation period follows before the pattern’s full target of $8.50 is tested, representing a 30.6% total correction from $12.25.
The broader market context matters here. As CoinsProbe noted when covering leverage flushing across major assets, altcoins with weakening technical structures are most vulnerable when macro pressure coincides with chart-level breakdowns.
The pattern is forming. The level is $12. Everything that follows depends on whether LINK closes below it on a sustained basis — or whether buyers step in before that close prints.
At the time of writing, Chainlink is trading at approximately $12.25, with $12.00 as the sole level that determines whether this remains a risk or becomes a confirmed 30% correction scenario.
Disclaimer: The views and analysis presented in this article are for informational purposes only and reflect the author’s perspective, not financial advice. Technical patterns and indicators discussed are subject to market volatility and may or may not yield anticipated results. Investors are advised to exercise caution, conduct independent research, and make decisions aligned with their individual risk tolerance.
Also Read: New Whales Now Hold 1/3 of Bitcoin’s Whale Realized Cap — Cost Basis Near $77K