Key Highlights LINK is near $8.75, up 3.71% in 24 hours and 9.66% over 30 days, with a $6.55B market cap. Whale activity has surged, with 246 transactions above $100K recorded in 24 hours, th
Key Highlights
- LINK is near $8.75, up 3.71% in 24 hours and 9.66% over 30 days, with a $6.55B market cap.
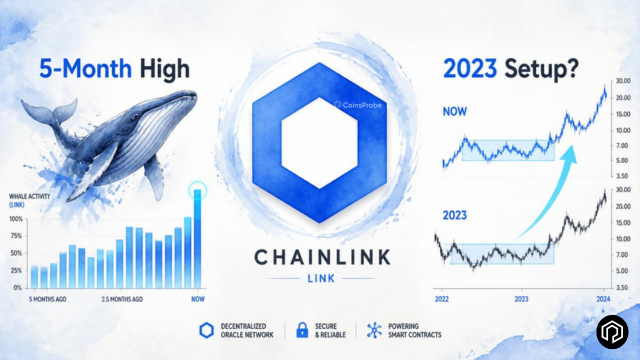
- Whale activity has surged, with 246 transactions above $100K recorded in 24 hours, the highest in five months.
- LINK’s $7–$10.86 accumulation zone closely mirrors the 2023 setup that preceded a 212% rally.
- The $14.41 100-week MA is the key confirmation level, while a weekly close below $7 would invalidate the bullish fractal.
Chainlink is quietly building one of the more technically and on-chain defined setups in the current altcoin market — a combination of five-month-high whale activity, rising supply concentration among large holders, and a weekly chart structure that is rhyming with the exact accumulation phase that preceded LINK’s most powerful recent rally.
At the time of writing, LINK is trading at approximately $8.75 with a market capitalization of $6.55 billion. The 24-hour gain of 3.71% and 30-day gain of 9.66% represent early signs of momentum building from the current base — but it is what is happening beneath the price action that has analysts and on-chain watchers paying closer attention.
 Chainlink (LINK) Price on 12 Aug 2026 | Source: Coinmarketcap
Highest Whale Activity in Five Months
The most immediately significant on-chain development for LINK comes from Santiment data showing that Chainlink just recorded its highest level of whale activity in five months — a clear anomaly in the flow data that is worth examining closely.
In a single 24-hour period, the Chainlink network saw 246 separate transactions valued at over $100,000 — a sharp spike in large-holder movement that stands out against the baseline of recent months. Transaction count at this scale is not noise; 246 individual $100,000+ transactions in 24 hours represents deliberate, high-conviction capital movement by participants with meaningful exposure.
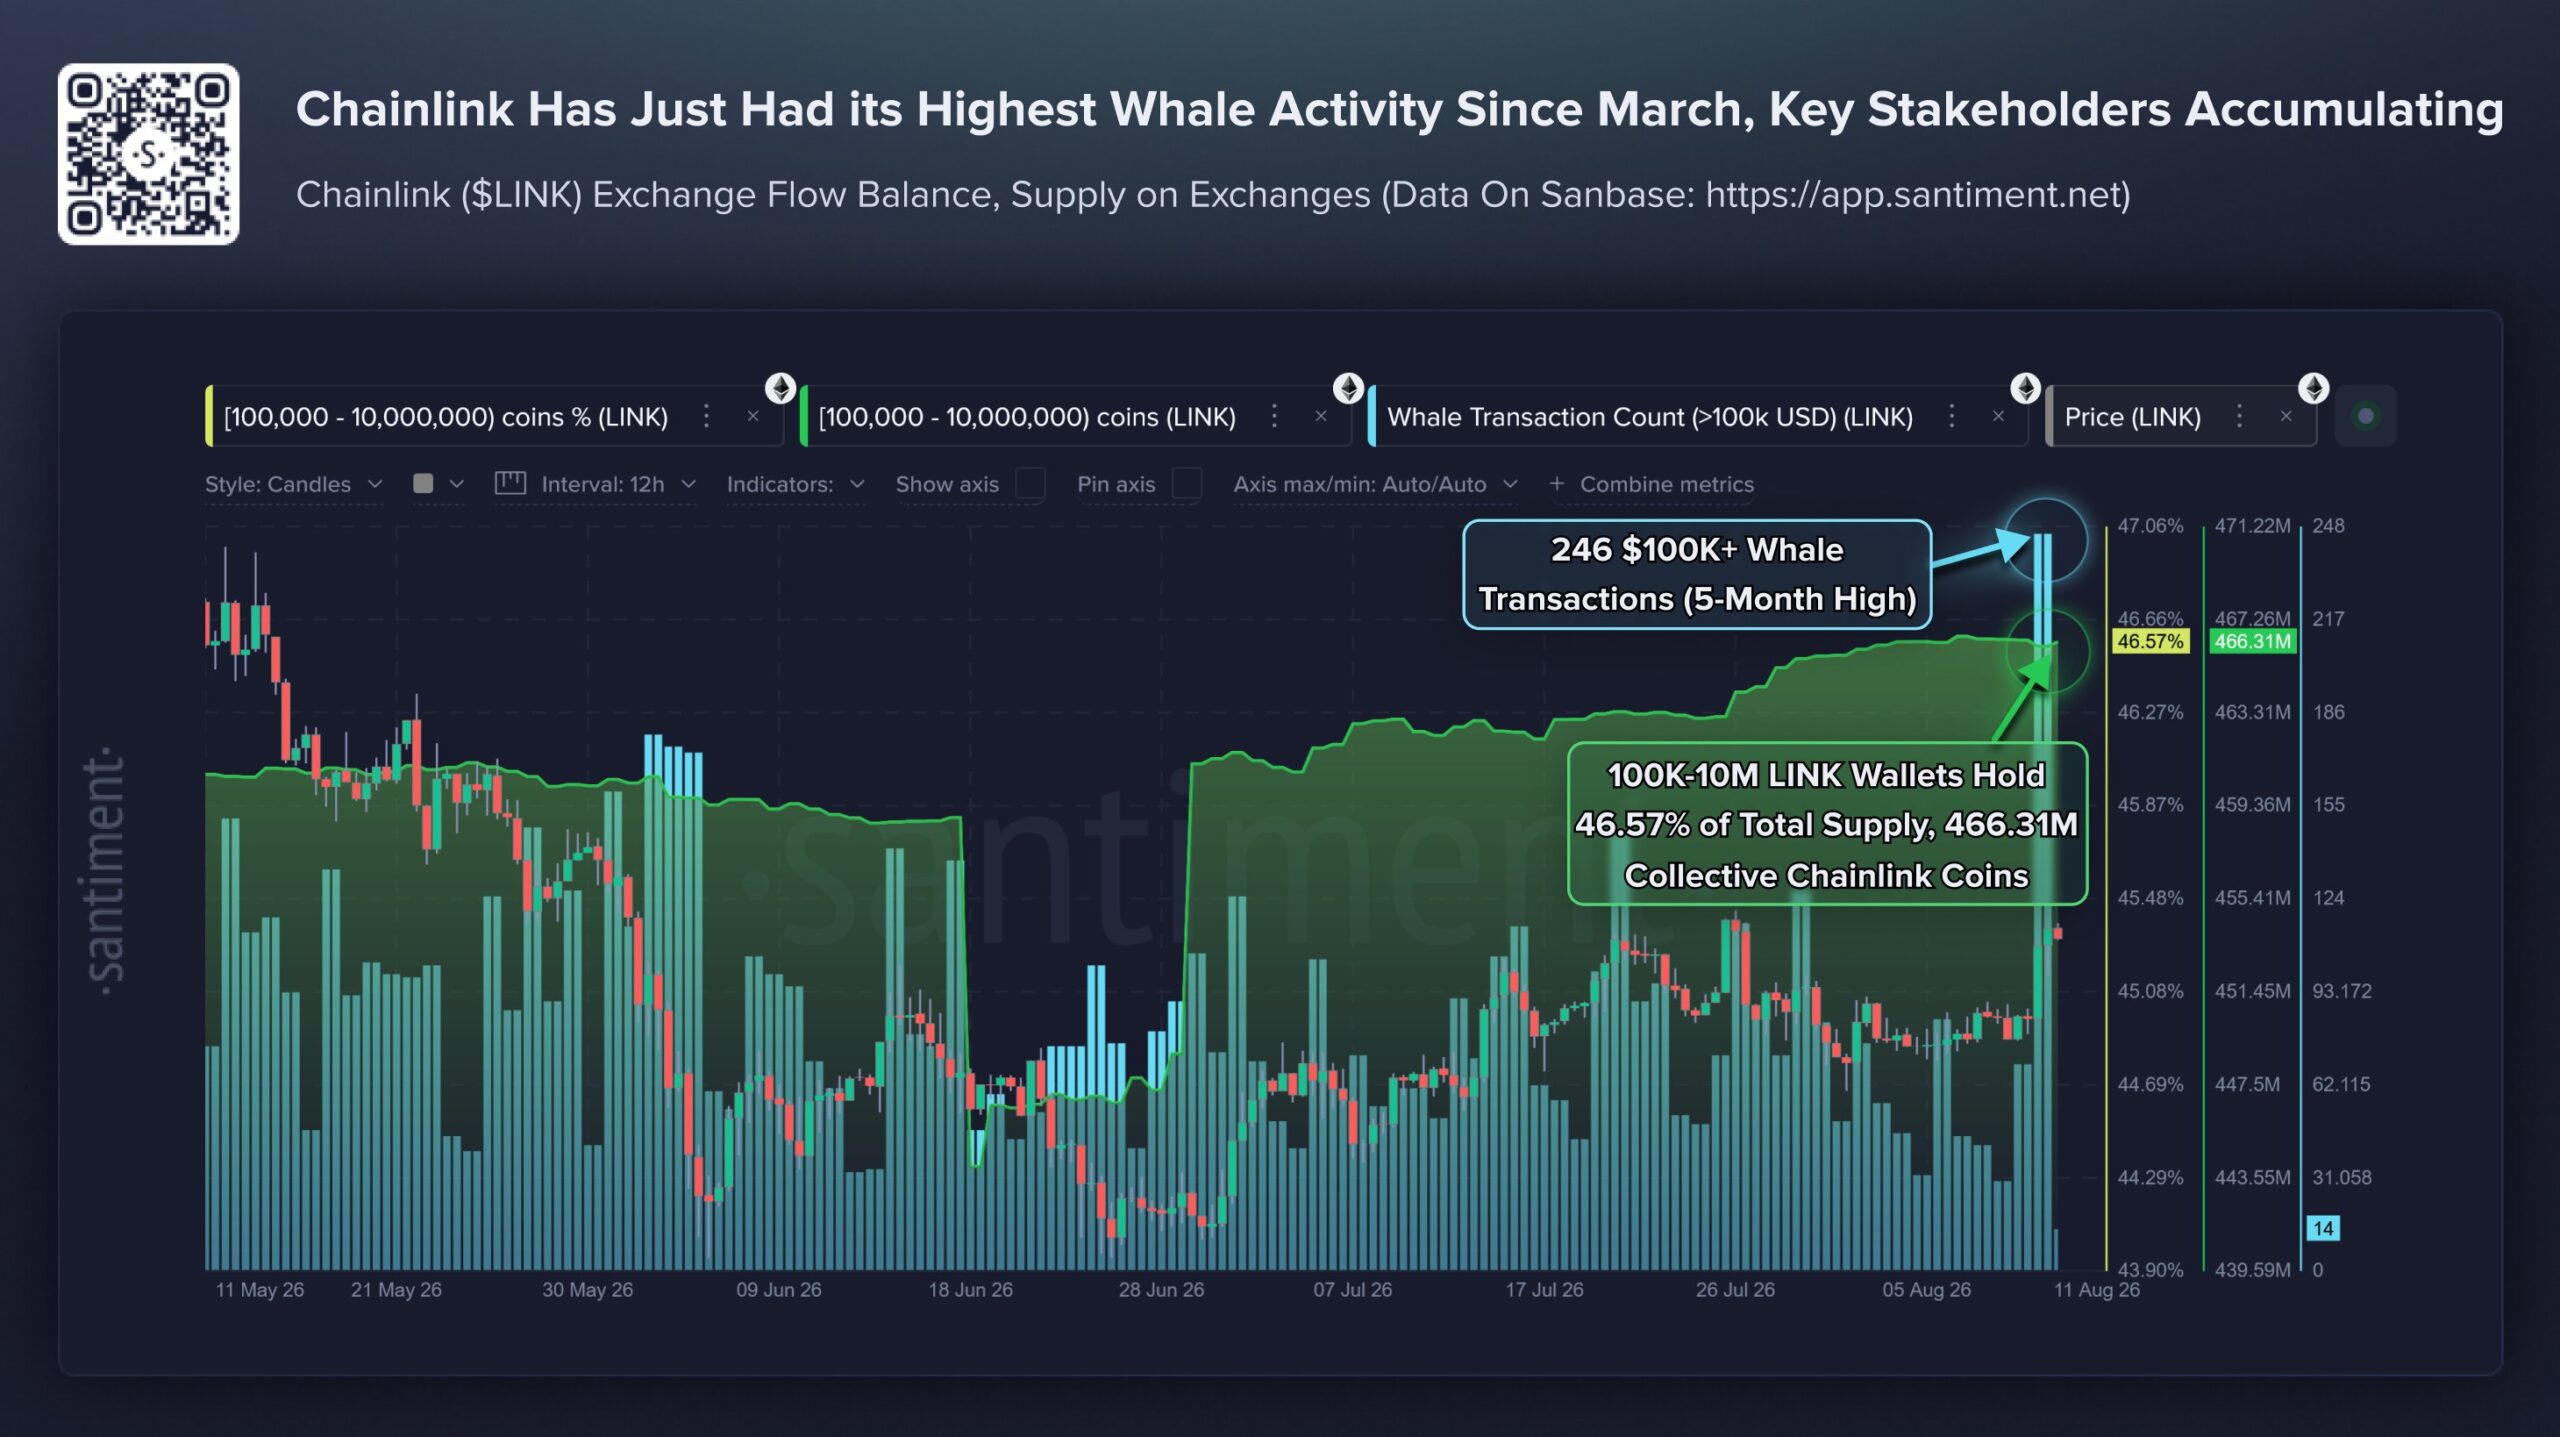 Chainlink Whale Activity/Source: @SantimentData (X)
As documented in our Chainlink whales accumulate to all-time high holdings analysis, large-holder behavior in LINK has been one of the most consistent leading indicators of directional price moves — and the current reading represents the strongest expression of that signal in five months.
Rising Supply Concentration Among Key Stakeholders
The whale transaction spike does not exist in isolation. It is accompanied by a parallel development in supply distribution that adds further weight to the accumulation thesis.
Wallets holding between 100,000 and 10 million LINK now control 466.31 million coins — equivalent to 46.57% of LINK’s total supply. This cohort of large but not exchange-scale holders has been increasing its share of the supply even as price has remained compressed in the $7–$10 range — precisely the behavior profile of accumulation rather than distribution.
Historically, this specific wallet cohort has shown a tendency to move in relative alignment with price direction — meaning that rising balance share among this group has typically preceded rather than followed upward price moves. The current combination of elevated transaction count and rising balance concentration among the 100K–10M LINK wallet cohort is one of the more constructive on-chain combinations LINK has produced in 2026.
Chainlink Fundamental Backdrop — Core Oracle Infrastructure Continues Expanding
The on-chain whale signals are developing against a fundamental backdrop that continues to strengthen even while LINK’s price has remained below its 2025 highs.
As covered in our Chainlink strongest network growth of 2026 analysis, Chainlink’s network metrics hit their strongest readings of the year earlier in 2026 — a fundamental indicator that usage and adoption are expanding independent of token price performance.
Chainlink continues to deepen its position as the dominant oracle infrastructure layer across multiple growth verticals simultaneously:
CCIP (Cross-Chain Interoperability Protocol) — expanding cross-chain lanes and enabling secure data and token transfers across an increasingly broad network of blockchain environments, establishing Chainlink as the connectivity layer between chains rather than a single-chain dependency.
Tokenized assets and RWA infrastructure — as institutional tokenization of real-world assets accelerates in 2026, Chainlink’s price feeds and data infrastructure are increasingly embedded in the tokenization stack, giving the protocol direct exposure to one of the highest-growth narratives in crypto.
Stablecoin and institutional data feeds — Chainlink’s oracle feeds underpin a significant share of DeFi stablecoin mechanisms and institutional-grade data requirements, providing consistent usage-driven demand regardless of market cycle phase.
New cross-chain lanes — ongoing expansion of CCIP lane coverage means Chainlink’s addressable market for oracle services grows with every new integration — a compounding network effect that strengthens the protocol’s moat over time.
This combination of expanding use cases across CCIP, tokenized assets, stablecoins, and institutional data feeds means Chainlink’s fundamental position is strengthening even during the current price consolidation — the same type of divergence between network growth and token price that characterized the setup before the 2023 accumulation phase resolved bullishly.
The 2023 Accumulation Fractal
Beyond the on-chain data, LINK’s weekly chart is producing one of the more striking pattern comparisons in the altcoin space — a structure that closely mirrors the accumulation phase that preceded its last major advance.
As covered in our Chainlink 2023 accumulation setup repeating analysis, the fractal comparison between LINK’s 2023 base and its current 2026 structure has been developing for several months. The current price action is continuing to track that template.
 Chainlink (LINK) Weekly Chart 12 Aug 2026/Coinsprobe (Source: Tradingview)
The Multi-Year Symmetrical Triangle
On the weekly chart, Chainlink has been trading within a multi-year symmetrical triangle that has been developing since the 2021 peak. Price declined from the August 2025 high near $27.86, found support around the $7 level, and has since entered a consolidation range that is building the lower boundary of the triangle structure.
2023 vs. 2026 — The Key Similarities
Feature2023 Accumulation2026 AccumulationAccumulation Range$4.92–$10.22$7.00–$10.86Pattern StructureBase within symmetrical triangleBase within symmetrical triangleKey Support~$4.92~$7.00Confirmation Threshold100-week MA reclaim100-week MA at $14.41Outcome (2023)+212% rally post-breakoutPending
The 2023 accumulation range of $4.92–$10.22 produced a 212% rally once LINK reclaimed its 100-week moving average and broke above the triangle’s resistance. The current accumulation range of $7.00–$10.86 is displaying a comparable base-building structure at a proportionally higher price level — consistent with a higher-cycle accumulation occurring within the same long-term triangle.
The 100-Week Moving Average at $14.41 — The Key Threshold
The 100-week moving average at $14.41 is the single most important technical level for the LINK fractal thesis. In 2023, reclaiming this moving average was the confirmation signal that the accumulation phase had transitioned into a directional expansion — and it preceded the bulk of the +212% advance.
In the current structure, a sustained reclaim of $14.41 would provide the same confirmation signal — indicating that the base-building phase is complete and the triangle is resolving to the upside. From the current price of $8.75, reaching $14.41 would represent approximately +65% upside before the pattern is even confirmed — and the measured move from the triangle resolution could extend well beyond that level if the fractal continues tracking the 2023 template.
The initial target post-reclaim is $15.50, with further upside potential if the broader multi-year triangle resolves with sustained momentum above the 100-week MA.
Bullish vs. Bearish Scenarios
Bullish Scenario
LINK holds $7.00 on a sustained weekly basis, continues building the accumulation base within the $7.00–$10.86 range, and whale activity remains elevated as the 46.57% supply concentration among large holders increases further. A break above $10.86 transitions the setup from accumulation to expansion, with the 100-week MA at $14.41 as the major confirmation target. A sustained reclaim of $14.41 validates the 2023 fractal and opens the path toward $15.50 and potentially higher if the multi-year symmetrical triangle resolves with full momentum. The combination of rising fundamental adoption (CCIP, RWA, stablecoins) and whale-level accumulation provides the structural support for this scenario.
Bearish Scenario
LINK loses $7.00 on a sustained weekly close — breaking the accumulation base, invalidating the 2023 fractal comparison, and shifting focus to lower support levels potentially in the $5.50–$6.00 range. In this scenario, the whale activity spike proves to be distribution rather than accumulation, and the supply concentration among large holders begins to decline. The fundamental network growth narrative remains intact but provides insufficient near-term support for token price recovery without the technical base structure holding.
Bottom Line
Chainlink is presenting a convergence of on-chain and technical signals that collectively describe one of the more carefully constructed setups in the current altcoin market. Five-month-high whale activity (246 transactions over $100,000 in 24 hours), rising supply concentration (46.57% held by the 100K–10M LINK wallet cohort), expanding fundamental adoption across CCIP and RWA infrastructure, and a weekly chart that is closely tracking the 2023 accumulation setup that preceded a 212% rally — all of these are developing simultaneously.
The setup is defined, testable, and historically grounded. $7.00 is the support that must hold. $10.86 is the first breakout signal. $14.41 on the 100-week MA is the fractal confirmation threshold that opens the measured move toward $15.50 and beyond.
Whether the 2026 structure completes the analogy to 2023 will ultimately be confirmed or denied by price action at these specific levels. But the weight of on-chain and technical evidence currently points toward a base-building phase that is maturing — not deteriorating.
Disclaimer: The views and analysis presented in this article are for informational purposes only and reflect the author’s perspective, not financial advice. Technical patterns and indicators discussed are subject to market volatility and may or may not yield the anticipated results. Investors are advised to exercise caution, conduct independent research, and make decisions aligned with their individual risk tolerance.
Also Read: Harmony ONE Exploit Explained: Attacker Mints 4 Billion Unauthorized Tokens — 27% of Supply