LINK faces downside risk as descending trendlines remain intact, with traders watching $11.80 support and lower price zones. Two possible corrective paths place November 5 on the calendar as
- LINK faces downside risk as descending trendlines remain intact, with traders watching $11.80 support and lower price zones.
- Two possible corrective paths place November 5 on the calendar as traders assess whether LINK could fall toward lower support.
- Binance leads LINK open interest and trading volume, while BingX records the highest futures trade count in the displayed figures.
Chainlink price remains under pressure after a recent decline, while technical projections suggest another corrective move could follow. Traders are watching nearby support, descending resistance, and November 5 for further direction.
LINK Chart Shows a Persistent Downtrend
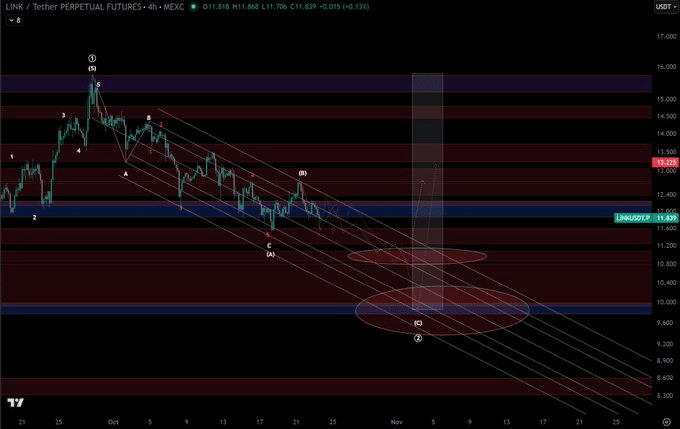
Nology (@nology3000) noted that LINK’s first corrective wave appeared complete. His later chart maps two possible paths for the next corrective phase. Both scenarios retain a downward bias, with November 5 marked as an important date.
Source:
X
The 4-hour chart reveals that LINK is eroding from its late September highs around $15.60. Lower highs and lower lows have since formed the price pattern. There are a number of down trendlines to support the challenge of maintaining a recovery.
LINK has been trading around USD 11.51 with a 4.68% 24-hour drop. It fell 4.98% over the past week and saw trading volumes of $201.6 million on a daily basis. These figures accompany a market structure that has yet to show a confirmed reversal.
The nearest reference area sits around 11.80–11.90, where price has recently traded. A sustained hold could support another attempt to recover lost ground. However, a break below this area would leave LINK exposed to lower support levels.
November 5 Frames Two Possible Paths
The chart uses Elliott Wave labels to map the next corrective section. The projections allow for different routes, although both feature a possible move lower. The wave count is not a definite forecast.
The first major resistance level is at $12.40. Above it, LINK faces another barrier between $13.20 and $13.50. Reclaiming these zones would weaken the current bearish structure and challenge the descending trendlines.
If support fails, the $11.20 region becomes an intermediate reference. Further weakness could bring 10.80–11.00 into focus before another possible reaction. These levels offer checkpoints rather than confirmed destinations.
The lower projection zone sits around 9.80–10.00, near a blue horizontal support band. Reaching it would require a further decline from current levels. A rebound before November 5, however, could alter the timing or invalidate the projected path.
Trading Activity Adds Context to LINK’s Move
The longer-term chart shows LINK’s earlier rallies coinciding with bursts of trading volume. One advance carried the token toward $30, while another later rise approached $25. Both moves eventually faded, followed by extended periods of weaker prices.
The recent recovery lifted LINK from its prolonged range around 7–10. Price advanced into September before retreating again, leaving the wider recovery incomplete. The historical chart also shows less activity during some quieter periods.
Exchange figures place Binance first in open interest at approximately $102.54 million. Gate follows with $95.16 million, while Bybit records $66.35 million. These totals show where futures positions are concentrated, but do not reveal traders’ overall directional bias.
Binance also leads reported LINK volume with roughly $93.36 million. MEXC follows at $47.41 million, while Bybit records $28.98 million. Binance has a total of 443,010 futures trade counts while BingX has 1.21 million.
Such rankings are based on different elements of market activity and are not interchangeable. Outstanding contracts are referred to as open interest, the traded value of contracts is known as volume and the number of contracts traded is known as trade count. None independently confirms whether LINK’s next move will be bullish or bearish.
For now, the price structure remains weak beneath descending resistance.$11.80 may permit a recovery attempt, but a failure may show lower zones. November 5 is another date in the projection, but price action will have to decide if that scenario unfolds.