$LINK is trading around $7.99 right now, sitting right at a support area that has decided its next major move before. Working out where this token could realistically land takes a proper look
$LINK is trading around $7.99 right now, sitting right at a support area that has decided its next major move before.
Working out where this token could realistically land takes a proper look at how this support area and its trendline have behaved before making any Chainlink price prediction 2029 calls.
Chainlink currently ranks 19th among all cryptocurrencies, holding a market cap close to $5.98 billion and a fully diluted value near $7.99 billion, out of a total supply of 1,000,000,000 tokens, with 748,099,970 already in circulation.
This Chainlink coin price prediction leans on that same support and trendline structure to build out realistic long-term targets.
Chainlink Price Today, 11 July 2026
Metric
Value
Current Price
$7.99
Market Cap
$5.98B
24H Volume
$174.95M
Circulating Supply
748,099,970 $LINK
Total Supply
1,000,000,000 $LINK
Chainlink Chart Structure Right Now
On the quarterly chart, LINK has once again landed on the exact same support area that once launched a rally of more than 500% the last time the price touched it.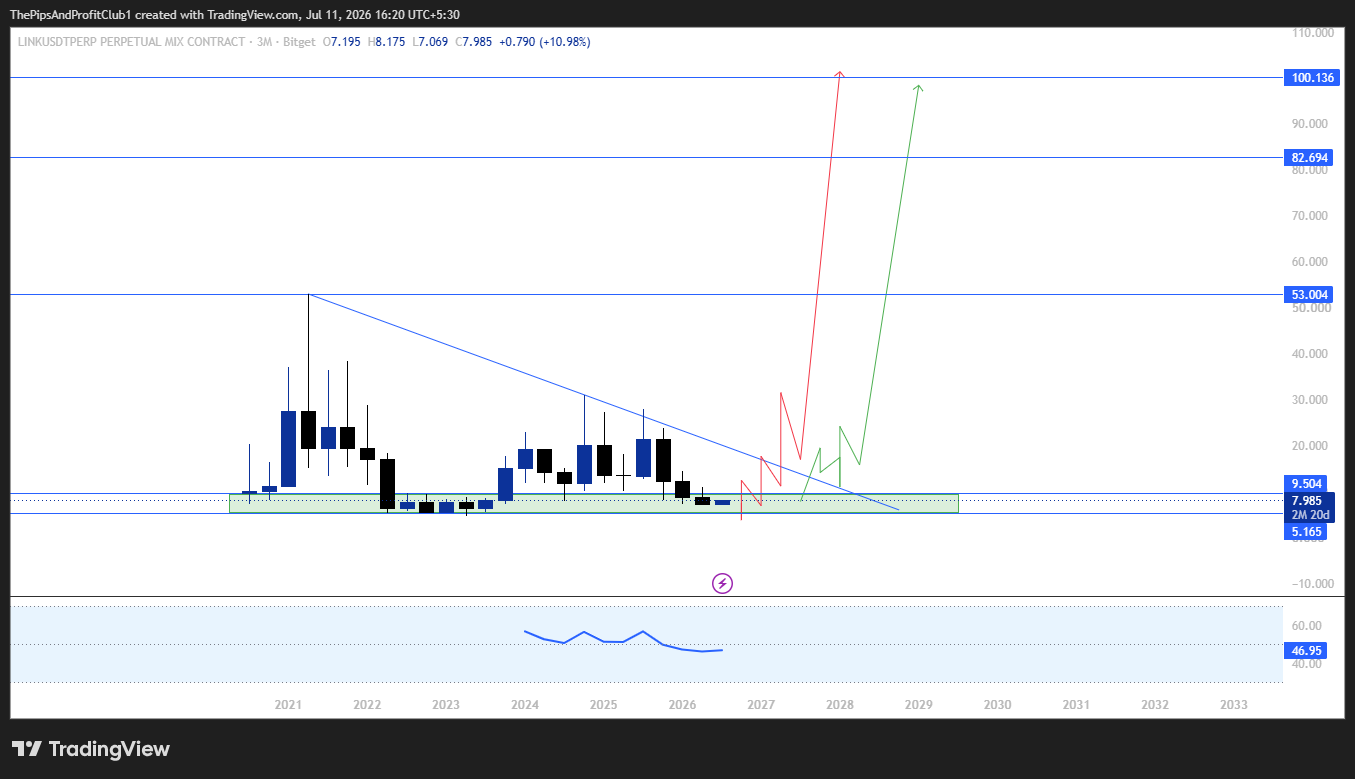
Back then, this zone acted as a springboard, and price shot up hard from that same area before eventually running into a long descending trendline overhead.
That trendline has been sloping down since 2021, and every time price has pushed up into it, sellers have stepped in and pushed price back down.
The most recent attempt was no different, with price getting rejected off that trendline and sliding all the way back to the support zone it started from.
So LINK is basically back at square one, sitting on the same support that has worked before.
If this area holds and the price manages to build a base here, the next step would be a slow climb back up toward that same trendline.
A period of sustaining just under the trendline, rather than rushing straight into it, tends to matter here since that's what usually sets up a real breakout instead of another rejection.
The quarterly RSI sits around 46.95, which is neutral territory, not overbought and not oversold either.
What This Setup Means Going Forward
If LINK holds this support and eventually clears the descending trendline with a proper breakout, the first real target on the table is a fresh all-time high, somewhere close to the $53 area marked on the chart.
From there, the next level to watch sits near $82.694, which lines up with the chart's next resistance marker.
Beyond that, price has room to stretch toward $100.136, and if momentum keeps building past that point, the last major target on this setup lands around $150.00.
On the other hand, if this support zone fails to hold, LINK would likely need more time building a base lower down before any fresh attempt at the trendline becomes realistic again.
Support and Resistance Levels
The current zone between roughly $5.165 and $9.504 is the key support to watch, since this is the same area that fueled the last major rally.
On the upside, the descending trendline itself is the first real hurdle, followed by resistance near $35, then $53 and $82.694; and finally, the $100.136 zone before any move toward the $150 target becomes realistic.
Chainlink Price Prediction 2029: Targets for the Next Cycle
Timeframe
Scenario
Min Target
Max Target
Key Trigger
2026
Range Defense
$5.20
$9.50
The current support zone holds
2026
Breakout Attempt
$12.00
$18.00
Early push toward the descending trendline
2027
Range Defense
$9.00
$15.00
Support intact, no fresh breakdown
2027
Breakout Attempt
$20.00
$35.00
A confirmed close above the descending trendline
2028
Extension Phase (Bearish)
$18.00
$30.00
Support holds; price grinds higher slowly
2028
Extension Phase (Bullish)
$35.00
$53.00
Momentum builds toward a fresh all-time high
2029
Cycle Peak Zone (Bearish)
$40.00
$60.00
A range-bound structure persists after the breakout
2029
Cycle Peak Zone (Bullish)
$82.00
$150.00
Full breakout confirmed past $100.136
These price projections are not guaranteed and are based on technical analysis, historical trends, and market assumptions. Actual Chainlink prices may vary significantly.
Risk and Reward: The Honest Version
Factor
Bull Case
Bear Case
Support Zone
Holds, fuels renewed long-term buying
Breaks down, structure weakens
Descending Trendline
A confirmed close above signals fresh upside
Rejects again, price stays capped
Resistance Near $100
Clears on strong volume, opens the path to $150
Fails to break; range extends longer
The analysis above combines historical price structure with publicly available market data and should not be treated as a guarantee of future performance.
Invalidation Level
This entire setup depends on the current support zone staying intact.
A close below roughly $5.165 would invalidate the bullish structure, and in that case LINK would likely need to build a new base lower down before any fresh attempt at the trendline and the higher targets becomes realistic.
Is Chainlink a Good Long-Term Investment
LINK's chart shows a token that has landed on this exact support zone before and used it as a launchpad for a massive move.
With the price sitting right back at that same zone now, a breakout above the long-standing descending trendline could be the trigger for a serious long-term run.
For anyone looking at a 2029 horizon, this support and trendline combination remains the key thing to track in this ongoing Chainlink price forecast.
Expert View
Sentiment around LINK has stayed fairly steady, with several analysts pointing to Chainlink's role in connecting real-world data to blockchain networks as a reason for long-term confidence in the project.
The current position right at major support is being watched closely, since a reaction here has historically decided the next big leg for the token.
Most agree the coming quarters near this support zone will be the real test of whether LINK is ready for its next major run toward higher targets by 2029.
Conclusion
LINK's chart really comes down to one structure right now, the support zone and descending trendline that have shaped price since 2021.
As long as this support zone stays intact, the path remains open toward the trendline breakout and the higher targets beyond it.
How LINK handles this support over the next few quarters will likely decide whether 2029 brings a serious breakout toward $150 or more time spent building at these lower levels for this Chainlink coin forecast.
Disclaimer: This article is for informational purposes only and should not be considered financial advice. Cryptocurrency markets are highly volatile, and price predictions are not guaranteed. Please do your own research before making any investment decisions.