Did Chainlink just shrug off a $68B market headline? LINK trades at $12.19 at 08:00 UTC on October 23, 2026, up 0.31% in 24 hours, and this Chainlink price prediction opens with a mild surpri
Did Chainlink just shrug off a $68B market headline?
LINK trades at $12.19 at 08:00 UTC on October 23, 2026, up 0.31% in 24 hours, and this Chainlink price prediction opens with a mild surprise.Yesterday's breakdown call leaned bearish. Sellers had the script. Buyers rewrote a few lines.
Yesterday's Prediction: Target vs. Actual Result
The timeframe runs from 09:20 UTC on October 22 to 08:00 UTC on October 23, 2026, using a 24-hour range of $11.81 to $12.23.
Yesterday's Level
Actual Result
Status
Base range of $11.873 to $12.368
Traded $11.81 to $12.23
Partially Hit
Reclaim $12.368, then $12.811
High of $12.23
Not Hit
Slide to $11.534
Low of $11.81
Not Hit
Final status: Partially Hit. Sellers poked under $11.873, but $11.534 never came close.
LINK Price Today: Market Snapshot
The LINK price today is $12.19 on CoinMarketCap data, inside a range of $11.81 to $12.23. Binance LINK/USDT trades at $12.224.
Trading Volume and Market Cap
Volume fell 13.67% to $234.21M, against a $9.12B market cap. Circulating supply is 748.09M of 1B LINK. Volume equals only 2.56% of market cap. Thin.
Why Is Chainlink Moving Today?
Breaking: LG CNS and Chainlink just announced a strategic partnership. Target: Korea's $68B digital asset market.
Chainlink's announcement went live roughly 11 hours before this update. Price barely flinched. Buyers defended the trendline.
Chainlink News: What the LG CNS Deal Covers
Chainlink news like this expands reach, not tomorrow's chart. LG CNS is the technology arm of LG Group, which spans 63 affiliates. It also leads the Bank of Korea's Project Hangang digital currency effort.
The plan: build cross-chain, data, and orchestration tools for Korean institutions. The earlier Asia context sits in theJapan Fulcrum news report. An institutional door just opened. A price trigger? Not yet.
Link: NYC on October 29, 2026
Link: NYC arrives in six days.Chainlink's event post pitches on-chain finance taking center stage in New York City.
Event weeks can pull in early positioning. But that's a possibility, not a promise.
Chainlink Technical Analysis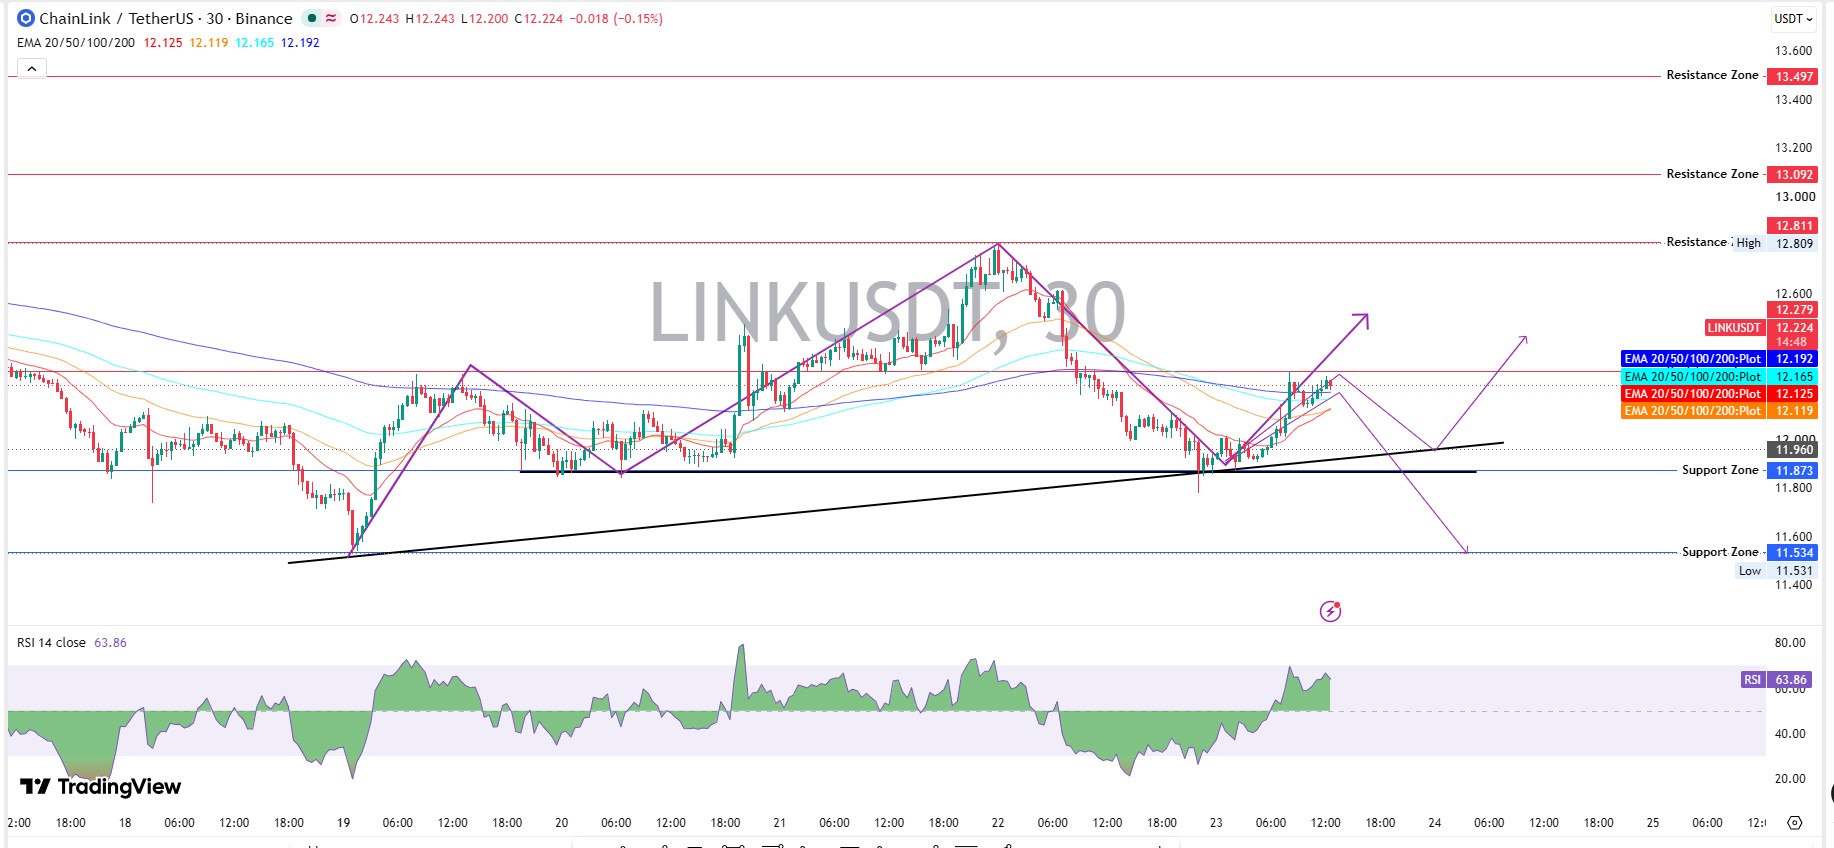
On the TradingView 30-minute chart, LINK has climbed along a rising trendline since October 19. A late October 22 dip then wicked to $11.81. Sellers tried to force a breakdown. Just not hard enough.
So Chainlink technical analysis leans cautiously bullish. Bearish felt right yesterday, though the trendline holding changes that.
The 20 EMA sits at $12.125, the 50 EMA at $12.119, the 100 EMA at $12.165, and the 200 EMA at $12.192.
Price at $12.224 trades above all four. That's short-term strength. Nothing more.RSI reads 63.86 now.
Key Support Levels
$LINK support and resistance start with floors. First sits $11.873, about 2.6% below $12.19, where the trendline meets a horizontal zone. Next comes $11.534, near the $11.531 low. That level echoes theCPI selloff support test.
Key Resistance Levels
Overhead, $12.279 comes first, marked by a red horizontal line. Then $12.811, $13.092 and $13.497. The $12.47 area, the focus of an earlierchannel breakout setup, sits in between.
Chainlink ETF Flows
SoSoValue LINK ETF data shows $0.00 net inflow on October 22, 2026, the fourth flat session in a row. Cumulative inflow holds at $179.23M.
Net assets slipped to $211.82M from $224.77M a day earlier. Grayscale's GLNK fell 5.97% and Bitwise's CLNK fell 6.48%. So who funds the next leg higher if Chainlink ETF buyers stay away?
Whale and Holder Snapshot
Etherscan holder data counts 916,011 holders. Whales, meaning very large wallets, number 4,165 and control 90.68% of market cap.
But the top 100 wallets hold 61.19%, and many belong to Chainlink's noncirculating supply. Concentration isn't always selling pressure.
Chainlink Price Prediction Scenarios
Scenario
Trigger
Target
Invalidation
Liquidity Condition
Bull
Trades above $12.279 and holds
$12.811, then $13.092
Trades below $11.873
Volume above $234.21M, ETF inflows return
Base
Chops between $11.873 and $12.279
Same range
Break of either edge
Volume near $234.21M, ETF flow flat
Bear
Trades below $11.873
$11.534
Reclaims $12.279
Thin volume, ETF net assets keep sliding
And the base case still carries the most weight.
Next 24 Hours and 7 Days
The base case favors $11.873 to $12.279 until 08:00 UTC on October 24, 2026.
Reclaiming $12.279 opens $12.811 by October 30, 2026, while losing $11.873 reopens $11.534. Link: NYC lands in between, and theearlier NYC channel test is the reference.
October 2026 Forecast
Month-end depends on ETF demand and the event reaction, as theOctober 2026 outlook frames it. A $LINK price forecast above $11.873 stays constructive. And a break below flips the month.
Chainlink Price Target: Can $LINK Reach $15 or $20?
A Chainlink price target of $15 needs +23.0% from $12.19 and a market cap near $11.22B. Then $20 needs +64.1% and about $14.96B.
That's a stretch without volume. Arecord ETF inflow would help the case.
Risks That Could Change the Chainlink Price Prediction
A trade under $11.873, shrinking volume, flat ETF flows, or whale selling would weaken the setup. Futures swings matter too, soCoinGlass LINK data offers a cross-check. Headline fade is another risk. Partnerships don't always move price.
Final Takeaway
Bias is cautiously bullish above $11.873, neutral inside $11.873 to $12.279, and bearish below. Volume decides which one wins.
Disclaimer: This Chainlink price prediction is for information only and isn't financial advice. Crypto prices swing fast, and scenarios aren't guarantees. Research independently before any trade.