$LINK is trading around $8.354 right now, holding just above a key flip zone while fresh reports of deeper institutional adoption add some extra buzz to the setup. The bigger Chainlink price
$LINK is trading around $8.354 right now, holding just above a key flip zone while fresh reports of deeper institutional adoption add some extra buzz to the setup.
The bigger Chainlink price prediction story today is really about whether this ascending trendline structure has one more push left in it, following adouble confirmation setup that buyers have been defending over the past few sessions.
LINK today's market snapshot
Metric
Value
Price
$8.354
24h Change
-0.05%
Market Cap
$6.25B
Futures Volume (24h)
$226.80M
Spot Volume (24h)
$32.48M
Open Interest
$445.80M
Circulating Supply
748.09M LINK
Total Supply
1.00B LINK
Max Supply
1.00B LINK
Chainlink News Today
As per Zach Humphries on X, Chainlink is getting some serious attention this week after reports surfaced that LINK is now tied into central bank-related projects across five major economies, reportedly including the US Department of Commerce, Brazil, Hong Kong, Singapore, and Australia.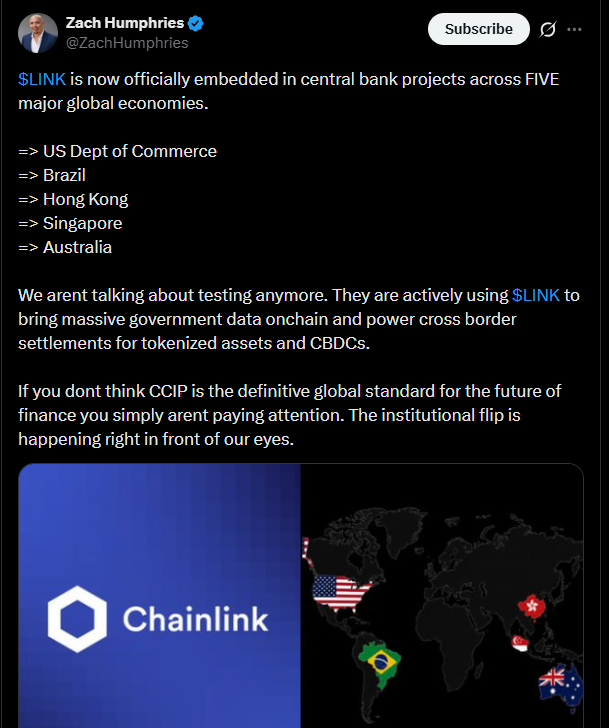
According to the commentary circulating online, these aren't pilot programs anymore; they're described as active use cases bringing government-level data
on-chain and supporting cross-border settlement for tokenized assets and CBDCs.
If that scale of adoption is accurate, it would mark a major step for CCIP as a settlement layer, and it raises the question of arally after pullback once the current setup resolves.
You can track thelive LINK price as this narrative develops.
Chainlink Liquidation Data
$LINK liquidation data fromLINK market data shows a fairly quiet picture so far, though longs have taken most of the pressure.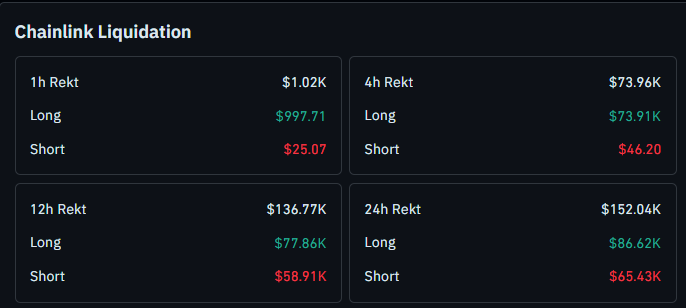
Over the past hour, $1.02K in total liquidations occurred, with $997.71 from longs against just $25.07 in shorts.
The 4-hour window shows $73.96K in liquidations, almost entirely from longs at $73.91K versus $46.20 in shorts.
Over 12 hours, liquidations climb to $136.77K, split between $77.86K in longs and $58.91K in shorts.
Across the full 24 hours, total liquidations reach $152.04K, with $86.62K coming from longs and $65.43K from shorts, according toLINK liquidation data.
The pattern shows leveraged longs getting squeezed slightly more than shorts as price chops around the flip zone.
Chainlink Technical Outlook
The $LINK price is currently trading along an ascending trendline. The first tap and second tap on this trendline both produced a higher high, but the third tap has not managed to create a new higher high yet. 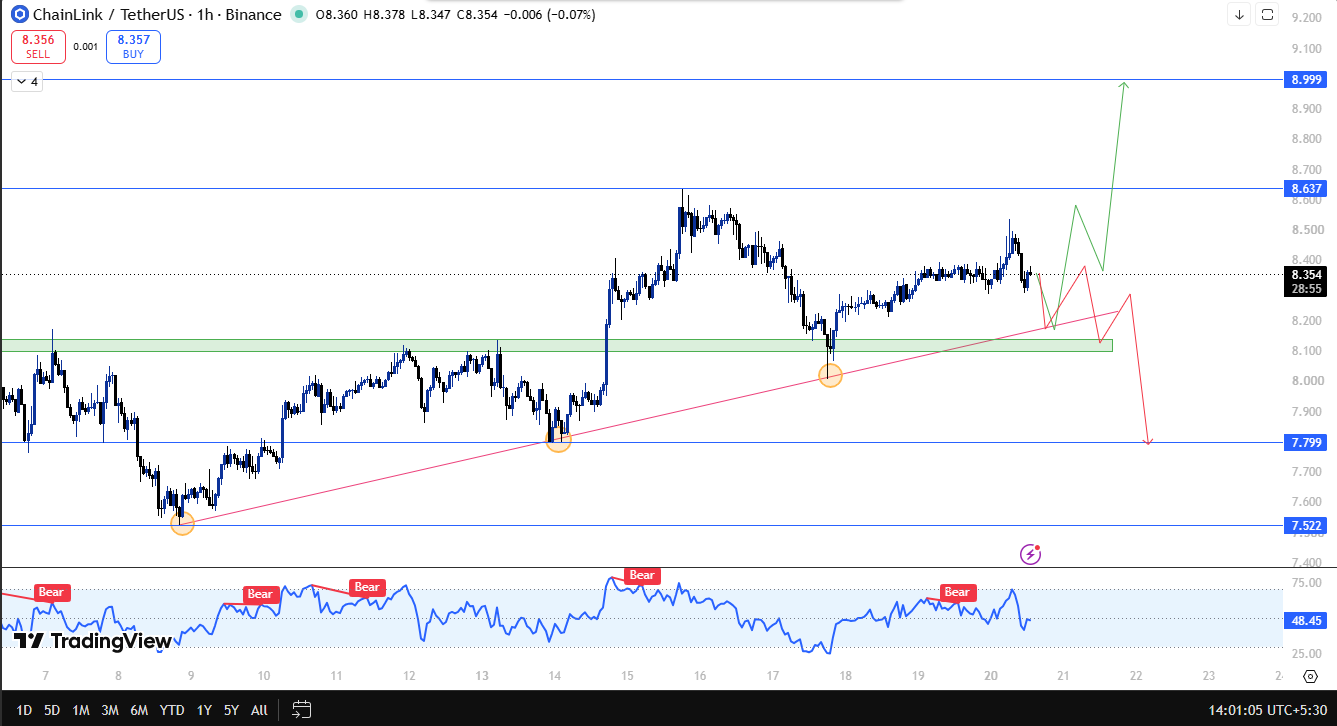
Even so, price is still holding above the flip zone, and the ascending trendline is running right past this same flip zone at $8.099 to $8.138, a setup similar to what played out in our earlier bullish breakout move coverage.
If the price sustains above the trendline and RSI dips below 30 while the trendline gets tapped again, buyers could step in and push LINK toward $8.637 and then $8.999.
That kind of move would echo the setup laid out in ourLINK price prediction 2030 outlook, where sustained trendline support was flagged as the key bullish trigger.
If the price instead breaks below the flip zone at $8.099 to $8.138 and closes below it, LINK could fall to $7.799, and if selling pressure continues from there, $7.522 is the next support level to watch. For a shorter-term read on how this could play out, ourLINK price prediction today page tracks this flip zone battle in real time.
Chainlink Support and Resistance Levels
Type
Level
Note
Resistance 2
$8.999
Bigger upside target if trendline holds
Resistance 1
$8.637
First target on a trendline bounce
Current Price
$8.354
Trading above the flip zone
Flip Zone
$8.099 - $8.138
Ascending trendline support, key battle zone
Support 1
$7.799
First support if flip zone breaks
Support 2
$7.522
Deeper support if selling continues
$LINK Risk-Reward Table
Case
Trigger
Target
Bull Case
Holds the $8.099 to $8.138 flip zone; RSI dips below 30 on a trendline tap
Move toward $8.637 and $8.999
Bear Case
Breaks and closes below $8.099 to $8.138
Slide toward $7.799 and $7.522
Invalidation Level
This bullish trendline setup would be invalidated if LINK closes below $8.099 on strong volume, since that would signal the flip zone and ascending trendline support have both failed, opening the path down to $7.799 and potentially $7.522.
Longer-term readers can compare this against ourprice prediction 2027 projections for how a deeper pullback could fit the bigger picture.
On the other side, a strong close back above $8.637 would suggest buyers are firmly back in control and could accelerate the move toward $8.999.
Expert View
As per CoinGabbar market analyst, Chainlink's technical picture is lining up at an interesting time, with LINK still respecting an ascending trendline even as the third tap has struggled to push price to a fresh higher high.
For the broader context behind this call, see our fullChainlink price prediction coverage.
The $8.099 to $8.138 flip zone remains the level that matters most right now, since holding it keeps the broader uptrend structure intact and opens the door toward $8.637 and $8.999, in line with thebreakout setup levels flagged earlier this month.
Add in the fresh reports around Chainlink's growing role in institutional and central bank infrastructure, and there's a fundamental narrative building alongside the chart that could give buyers extra conviction if the trendline holds, especially with talk of afirst LINK ETF still circulating in the background.
A breakdown below the flip zone, on the other hand, would shift the focus quickly toward $7.799 and $7.522.
Disclaimer: This article is for informational purposes only and should not be considered financial advice. Cryptocurrency markets are highly volatile, and price predictions are not guaranteed. Please do your own research before making any investment decisions.