Did Chainlink just slip out of the $12 trap? LINK trades at $12.34 as of 06:00 UTC on October 21, 2026, up 2.55% in 24 hours. This Chainlink price prediction picks up where theOctober 2026 ou
Did Chainlink just slip out of the $12 trap?
LINK trades at $12.34 as of 06:00 UTC on October 21, 2026, up 2.55% in 24 hours.
This Chainlink price prediction picks up where theOctober 2026 outlook left off.
A descending channel breakout showed up overnight. Buyers finally got a win.
But yesterday's levels tell a more careful story.
Yesterday's Prediction: Target vs. Actual Result
Yesterday's Chainlink forecast named $12.251 as the first hurdle inside a 7 to 30 day window.
Measured from 12:00 UTC on October 20 to 06:00 UTC on October 21, 2026, the results are mixed.
Yesterday's Level
Actual Result
Status
Break above $12.251
24-hour high of $12.44
Hit
Push to $12.72, then $13.497
Not reached
Not Hit
Drop below $11.534 toward $10.599
24-hour low of $11.88
Not Hit
Final status: Partially Hit. Bulls cleared $12.251, and $13.497 stays open inside the original window.
LINK Price Today: Market Snapshot
The LINK price today is $12.34 on CoinMarketCap data, up 2.55% in 24 hours. The 24-hour range ran from $11.88 to $12.44.
Trading Volume and Market Cap
Volume reached $232.28M, up 15.03%. Market cap is $9.23B.
That makes volume to market cap 2.51%, up from 2.17% yesterday. The ratio compares daily trading with total size.
Why Is Chainlink Moving Today?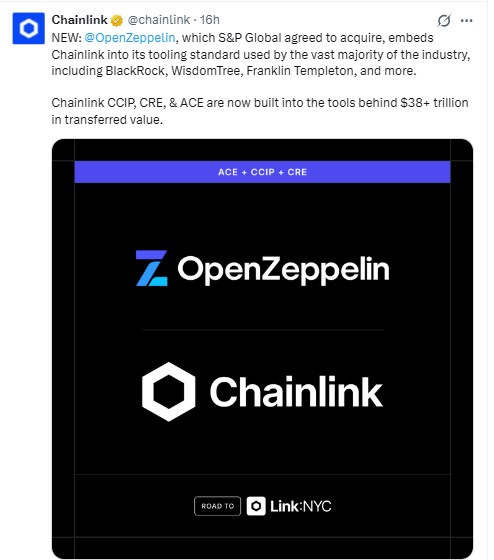
Fresh Chainlink news. OpenZeppelin, which S&P Global agreed to acquire, now builds Chainlink into its tooling standard.
That standard reaches BlackRock, WisdomTree, and Franklin Templeton, per theOpenZeppelin integration post.
The price jumped from near $11.90 to above $12.40 hours later. Timing fits. Proof doesn't.
Kamino CCIP Security Review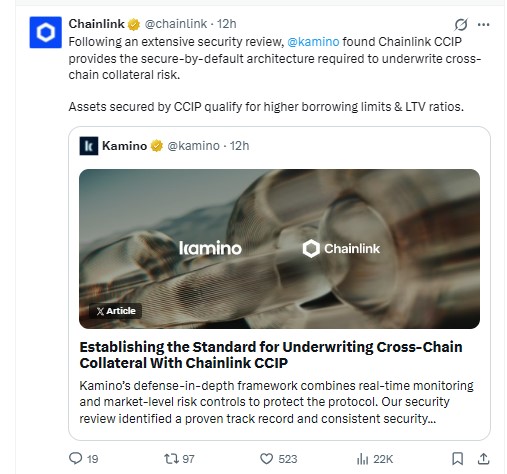
Kamino ran an extensive security review of Chainlink CCIP, the cross-chain messaging layer.
It found the design secure enough to underwrite cross-chain collateral, and assets secured by CCIP qualify for higher borrowing limits, per thisKamino CCIP review.
Chainlink Technical Analysis
This Chainlink technical analysis uses the 30-minute chart, so signals shift fast.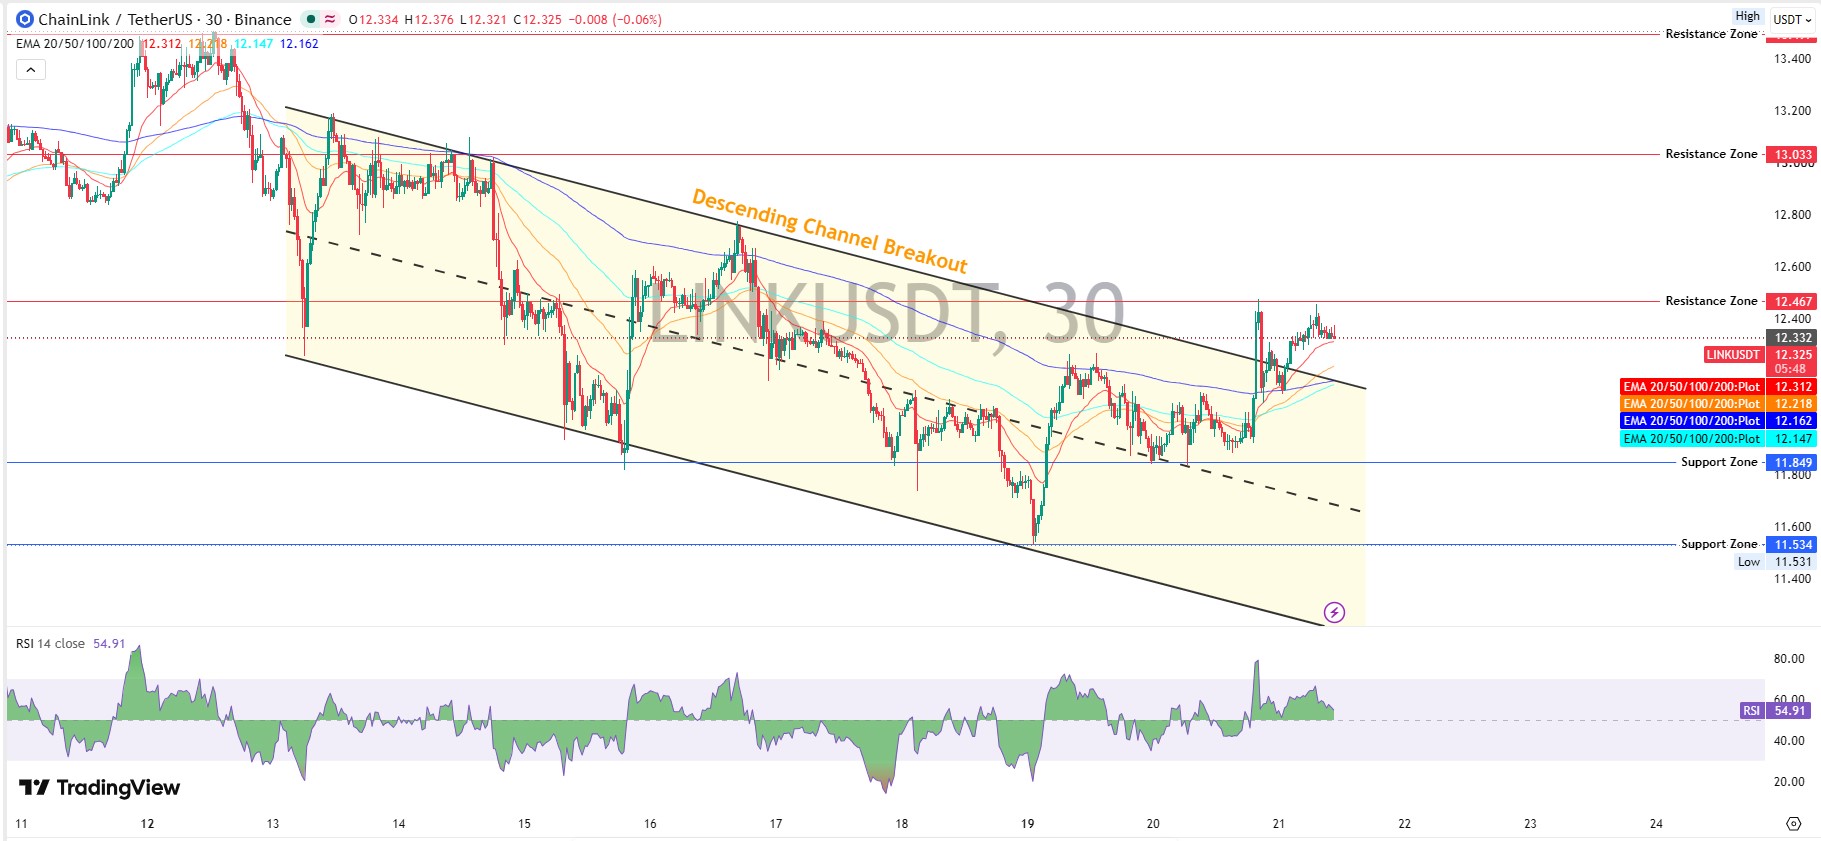
Descending Channel Breakout
On the TradingView 30-minute chart, LINK pushed through the upper line. Young breakouts fail often. This one needs one thing. Follow-through.
The 20 EMA sits at $12.312, the 50 EMA at $12.218, the 100 EMA at $12.162, and the 200 EMA at $12.147.
Price trades above all four. Feels like a squeeze at first. Then again, holding above every EMA says buyers aren't just covering shorts. RSI is 54.91. Neutral, with room to run.
Key Support Levels
LINK support and resistance zones start with floors. Support is where buyers stepped in before.
First sits $11.849, about 4.0% below spot. Next is $11.534, near the $11.531 low, a floor echoed in theCPI selloff support test.
Key Resistance Levels
Resistance is where sellers pushed the price back before. First comes $12.467, just 1.03% above spot, then $13.033, about 5.6% higher.
The earlierNYC channel test showed how stubborn this area gets. A break needs one thing first. Participation.
Is the LINK Breakout Real or Fake?
A fake breakout is a move above a trendline that fades back inside the channel within hours. Genuine ones hold, and volume backs them.
Real signs exist. Price trades above all four EMAs, volume rose 15.03% and shorts took most liquidations.
Fake signs exist too. ETF flows sit at $0, RSI at 54.91 shows no surge, and the 30-minute chart is a short window.
Verdict: real, but unproven. A hold above $12.467 would confirm it, while a drop under $12.147 would make it fake.
Futures Positioning and Liquidations
Open interest is the total value of open futures contracts.CoinGlass LINK data shows $606.90M, and futures volume of $348.10M dwarfs $53.81M in spot.
Liquidations are forced exits from leveraged bets. Most of the $258.69K wipeout in 24 hours hit one side. Shorts, at $194.78K. If shorts did most of the lifting, who's left to push the next leg?
Chainlink ETF Flows
Chainlink ETF flows went quiet.SoSoValue ETF data shows $0 net inflow on October 20, 2026, after an outflow of $397.26K on October 16.
Cumulative net inflow holds at $179.23M. Demand paused. And a pause isn't support.
Whale and Holder Snapshot
Etherscan counts 916,251 holders. Whales, wallets with huge balances, number 4,201, and control 90.72% of the market cap tier, perEtherscan holder data.
But many top wallets are Chainlink's own noncirculating supply, so concentration isn't automatic selling.
Chainlink Price Prediction Scenarios
The table below frames this Chainlink price prediction across the next 7 to 30 days. A LINK price prediction toward $13.033 needs volume first, much like therecord ETF inflow stretch.
Scenario
Trigger
Target
Invalidation
Liquidity Condition
Bull
Trades and holds above $12.467
$13.033, then $13.497
Falls under $12.147
Volume above $232.28M, ETF inflows return
Base
Chops between $12.147 and $12.467
Same range
Break of either edge
Volume near $232.28M, flat ETF flow
Bear
Trades below $11.849
$11.534
Reclaims $12.312
Thin volume, fresh long liquidations
Chainlink Price Forecast by Timeframe
This Chainlink price forecast splits time into three windows.
Chainlink Price Outlook: Next 24 Hours
The base case favors a $12.147 to $12.467 range.
LINK Price Forecast: Next 7 Days
A push above $12.467 opens $13.033, while a slide under $11.849 reopens $11.534.
Chainlink Price Forecast: Next 30 Days
Outcome hinges on ETF demand and Link:NYC attention. Anothervolume stall would cap gains.
Risks That Could Change the Chainlink Price Prediction
A failed breakout, thin volume, stalled ETF demand, or whale movement could flip the setup.
A drop under $12.147 would turn this into a trap, as thereserve buy bounce fade showed.
Final Takeaway
Mildly bullish near term, neutral while $12.147 holds. Watch $12.467 first.
This Chainlink price prediction turns cautious below $11.849. And fresh buying, like the earlierETF inflows breakout, would strengthen the case.
Disclaimer: This Chainlink price prediction is for information only and isn't financial advice. Crypto prices swing fast, and scenarios aren't guarantees. Research independently before any trade.
