A Chainlink whale just sent shockwaves through the market, moving nearly $9.23 million worth of $LINK onto Coinbase, and the timing could not be more dramatic. This Chainlink price prediction
A Chainlink whale just sent shockwaves through the market, moving nearly $9.23 million worth of $LINK onto Coinbase, and the timing could not be more dramatic.
This Chainlink price prediction lands right as LINK sits at the most sensitive point of its chart, perched exactly on top of a breakout level that could decide the next big move. Is the whale positioning for a dump, or is something else in play?
The levels discussed below come from the 1-hour LINKUSDT chart and should be rechecked if the price closes meaningfully outside the stated range.
LINK Price Right Now
Metric
Value
Price
$9.472 (CoinGlass: $9.455, +0.85%)
24h Futures Volume
$501.09M
24h Spot Volume
$60.70M
Market Cap
$7.08B
Open Interest
$658.46M
Circulating Supply
748.09M
Max Supply
1.00B
Open interest represents the total value of active LINK futures contracts still open in the market, and a reading near $658M shows leveraged traders are heavily positioned around current levels. Data as of Aug 17, 2026, 10:22 IST (04:52 UTC).
Chart source:LINKUSDT Perpetual, 1H timeframe, Bybit via TradingView, captured Aug 17, 2026, 10:22 IST.Methodology and Data Sources: Price and volume data sourced from CoinGlass, liquidation figures from CoinGlass, whale wallet activity from Onchain Lens via Arkham Intelligence, and ETF flow data from the CoinGlass Spot ETF tracker.
The Whale Behind the Selling Pressure
As per Onchain Lens on X, a Chainlink whale that deposited 984.55K LINK, worth roughly $9.23 million, to Coinbase just two hours before this report, a move that typically signals an intent to sell.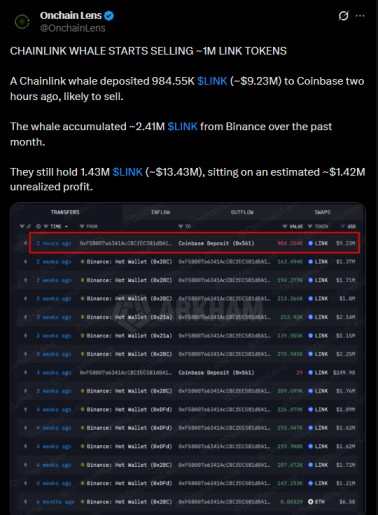
This same wallet had quietly accumulated about 2.41 million $LINK from Binance over the past month, building a position before now stepping back.
Even after this deposit, the whale still holds 1.43 million LINK worth close to $13.43 million, sitting on an estimated $1.42 million in unrealized profit.
That means more supply could hit exchanges if price cooperates. Source: Onchain Lens, Aug 17, 2026.
On the ETF side, LINK spot ETF products logged a net inflow of $1.47M on Aug 14, pushing cumulative net inflows to $129.36M, though Aug 13 saw a $390.58K outflow. 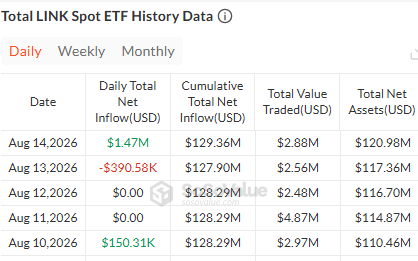
Total net assets across LINK spot ETFs stood at $120.98M as of Aug 14. Source: SoSOValue Spot ETF Data, Aug 14, 2026.
Liquidation Snapshot
Liquidation data over the past day tells an interesting story.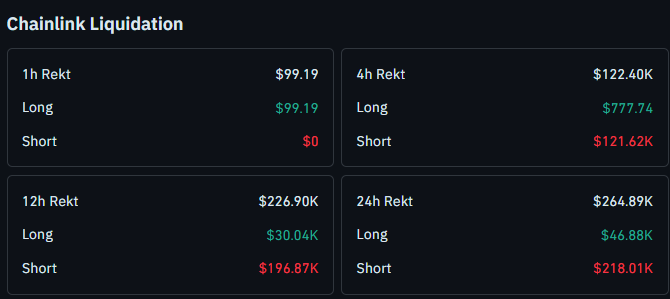
In the last hour, only $99.19 in longs were wiped out with zero short liquidations.
But zoom out to 24 hours and shorts have taken the bigger hit, with $218.01K in short liquidations against $46.88K in longs, out of a total $264.89K rekt.
The 12-hour window shows the same lean, $196.87K in shorts liquidated versus just $30.04K in longs.
This suggests traders betting against LINK have been getting squeezed more than bulls in the recent stretch. Source: CoinGlass, Aug 17, 2026, 10:22 IST.
Trend and Momentum: Key Takeaways
Price is trading near $9.472, just under its breakout trigger zone
A close above $9.752 opens the door toward $10.044 and $10.873
A close below $9.289 would invalidate the current breakout attempt
A confirmed breakdown targets $8.925 first, then $8.485
A whale deposited 984.55K LINK (~$9.23M) to Coinbase two hours before this report, likely to sell
Short liquidations are dominating the 12h and 24h windows, hinting at short-side stress, not long-side panic
Trading breakout zones like this carries real risk of false breakouts and sudden liquidity grabs, especially with leveraged positions active on both sides.
Treat every level here as a zone to watch, not a guaranteed outcome
Chainlink Price Prediction: 1-Hour Chart Breakdown
Chainlink recently gave a breakout from a symmetrical triangle pattern and is currently trading right near that breakout level.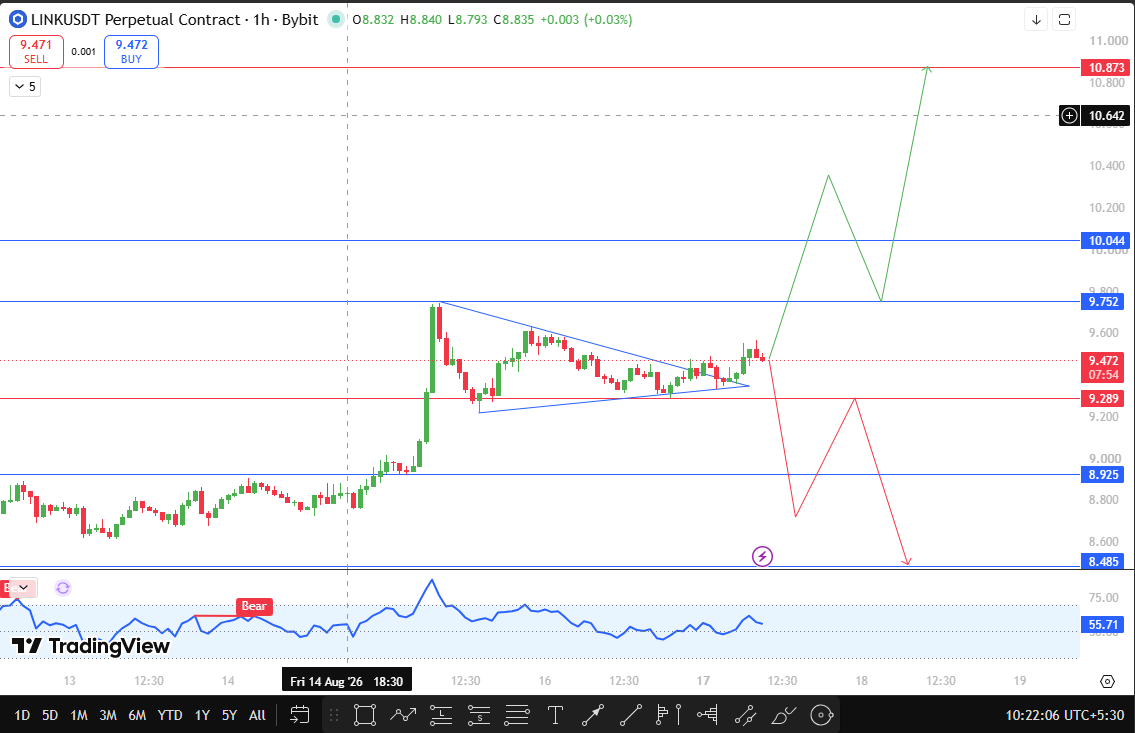
If the price breaks and closes above $9.752, the next resistance targets line up at $10.044 and $10.873.
On the flip side, if the price breaks and closes below $9.289, this breakout attempt fails, and LINK could slide toward support at $8.925, with $8.485 as the next level below that.
Support and resistance levels are recent swing highs and lows.
Technical Outlook Snapshot
Indicator
Signal
Pattern
Symmetrical triangle breakout, retesting trigger zone
Built-in Oscillator
Bear tag shown near recent candles, reading around 55.71
Immediate Bias
Neutral to cautious until a clean close forms above or below key levels
Support and Resistance Levels to Watch
Type
Level
Note
% From CMP
Resistance
$10.873
Extended target on breakout continuation
+14.79%
Resistance
$10.044
Secondary resistance zone
+6.04%
Resistance
$9.752
Confirmation trigger for bullish breakout
+2.96%
Support/Trigger
$9.289
Breakout invalidation level
-1.93%
Support
$8.925
First downside target on breakdown
-5.77%
Support
$8.485
Extended downside target
-10.42%
Risk-Reward Table
Case
Trigger
Target
Bullish
Close above $9.752
$10.044, then $10.873
Bearish
Close below $9.289
$8.925, then $8.485
What Would Change This Chainlink Price Prediction?
A sustained hourly close above $9.752 or below $9.289 would be the clearest signal to revisit this setup, since both levels sit at the edges of the current breakout structure.
Continued whale outflows to exchanges would also add weight to the bearish case if they keep showing up.
How Bitcoin Sentiment Could Move Chainlink
$LINK, like most altcoins, tends to take cues from broader Bitcoin sentiment.
A risk-off shift across crypto markets could pressure LINK toward its lower support zone faster, while renewed strength in Bitcoin could help LINK punch through its $9.752 trigger with more conviction.
When This Chainlink Price Prediction Gets Revisited
This setup will be revisited if LINK closes an hourly candle beyond either $9.752 or $9.289, or if fresh large-wallet movements change the exchange supply picture meaningfully.
Glossary
Symmetrical Triangle: A chart pattern formed by converging trendlines, often preceding a breakout in either direction
Open Interest: Total value of outstanding futures contracts not yet settled
Liquidation: Forced closure of a leveraged position when losses hit the maintenance margin
Whale: A wallet holding a large enough token balance to influence market price through its trades
Bull, Base, and Bear Case
Bull Case: Price closes firmly above $9.752, shrugging off whale selling pressure, and pushes toward $10.044 and eventually $10.873 as short liquidations continue to add fuel.
Base Case: Price chops around the $9.289 to $9.752 range as the market digests the whale's Coinbase deposit, with no clean breakout or breakdown confirmed yet.
Bear Case: Price closes below $9.289, the breakout fails, and the price grinds down toward $8.925 with $8.485 as the deeper target if selling pressure from the whale's remaining 1.43M LINK holdings continues.
Disclaimer
This article is for informational purposes only and does not constitute financial advice. Cryptocurrency markets are highly volatile, and prices can move sharply in either direction. Always do your own research and consult a licensed financial advisor before making investment decisions.