Chainlink price prediction chatter is buzzing around the LINK trendline break zone, where a clean bear trap just flushed out the wrong side before the price ripped higher into new territory.
Chainlink price prediction chatter is buzzing around the LINK trendline break zone, where a clean bear trap just flushed out the wrong side before the price ripped higher into new territory.
Traders who called this setup early are now watching to see if the next move confirms or fades.
Quick Take: LINK is trading near $8.795 on the 4-hour chart after breaking its prior high and closing above $8.764 to confirm the move.
A small pullback here would not break the structure, and a fresh breakout could open the door toward $9.312 and $9.686, with $10.262 as a further extension.
A confirmed close below $8.287 would flip the setup bearish, with $8.006 and $7.789 as the next supports.
This is a 4-hour read and should be rechecked if the price closes decisively beyond either level.
$LINK Price Right Now And Market Snapshot
Metric
Value
Price
$8.795
24h Change
+3.76% (+$0.3179)
Market Cap
$6.56B
Futures Volume (24h)
$250.44M
Spot Volume (24h)
$42.50M
Open Interest
$460.14M
Circulating Supply
748.09M LINK
Total Supply
1.00B LINK
Max Supply
1.00B LINK
The price is taken from the live TradingView chart, with volume, market cap, open interest, and supply figures from Chainlink data on the CoinGlass LINK market page, as of July 27, 2026, at 10:52:35 IST.
Methodology And Data Sources
This LINK technical analysis uses the 4-hour LINK/USDT chart on Binance via TradingView for price structure, with volume, open interest, and market cap figures from CoinGlass and liquidation flow from CoinGlass's LINK liquidation tracker.
All levels are treated as invalidated only on a confirmed 4-hour candle close beyond the stated trigger, not an intraday wick.
Why Is $LINK Price Moving Today
This Chainlink price prediction is getting extra fuel from the network's own numbers. 
As per a BSCNews update on Chainlink metrics, Chainlink's oracles have now enabled $32.8 trillion in transaction value, according to the project's official dashboard, and $LINK currently secures roughly $45.6 billion through smart contract applications running on those oracles.
That kind of scale is a reminder of how deeply Chainlink sits inside the infrastructure of the wider crypto market.
ETF flows are adding a bullish tilt too. 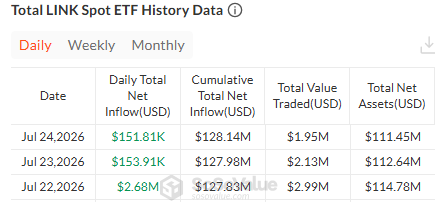
Daily ETF data on SoSovalue shows hows net inflows of $151.81K on July 24 and $153.91K on July 23, with a much larger $2.68M inflow on July 22, pushing the cumulative net inflow figure to $128.14M even as total net assets eased slightly to $111.45M from $114.78M over the same stretch.
The full history sits on the LINK spot ETF tracker. Steady inflows alongside a confirmed technical breakout is exactly the kind of combination that gets a setup like this taken seriously.
$LINK Liquidation Data And Long Short Squeeze
Liquidation flow over the past day is lopsided in one direction, and it is not the direction short sellers wanted.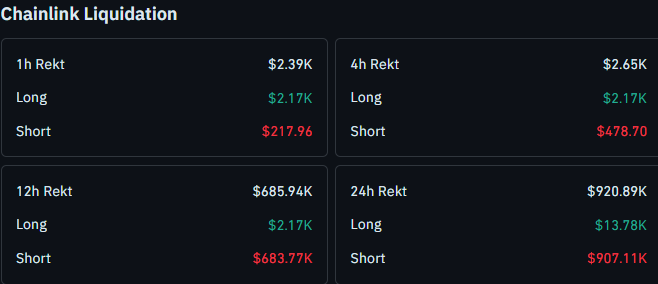
Over the past hour, $2.39K was liquidated, with $2.17K in longs against just $217.96 in shorts. The 4-hour window shows $2.65K total, again mostly longs at $2.17K versus $478.70 in shorts.
The bigger windows tell the real story. Over 12 hours, total liquidations hit $685.94K, with shorts absolutely dominating at $683.77K against only $2.17K in longs.
Across the full 24 hours, liquidations reach $920.89K, and shorts make up $907.11K of that versus just $13.78K in longs.
That is about as one-sided as a liquidation split gets, and it lines up perfectly with the bear trap narrative: traders piled into shorts expecting a breakdown, got trapped, and were forced out as the price broke higher.
The complete breakdown sits on the $LINK liquidations dashboard on CoinGlass.
$LINK Technical Analysis Ascending Trendline Breakout Setup
The setup here plays out almost exactly as flagged in our last update, which called for watching a trendline breakdown or a trap. 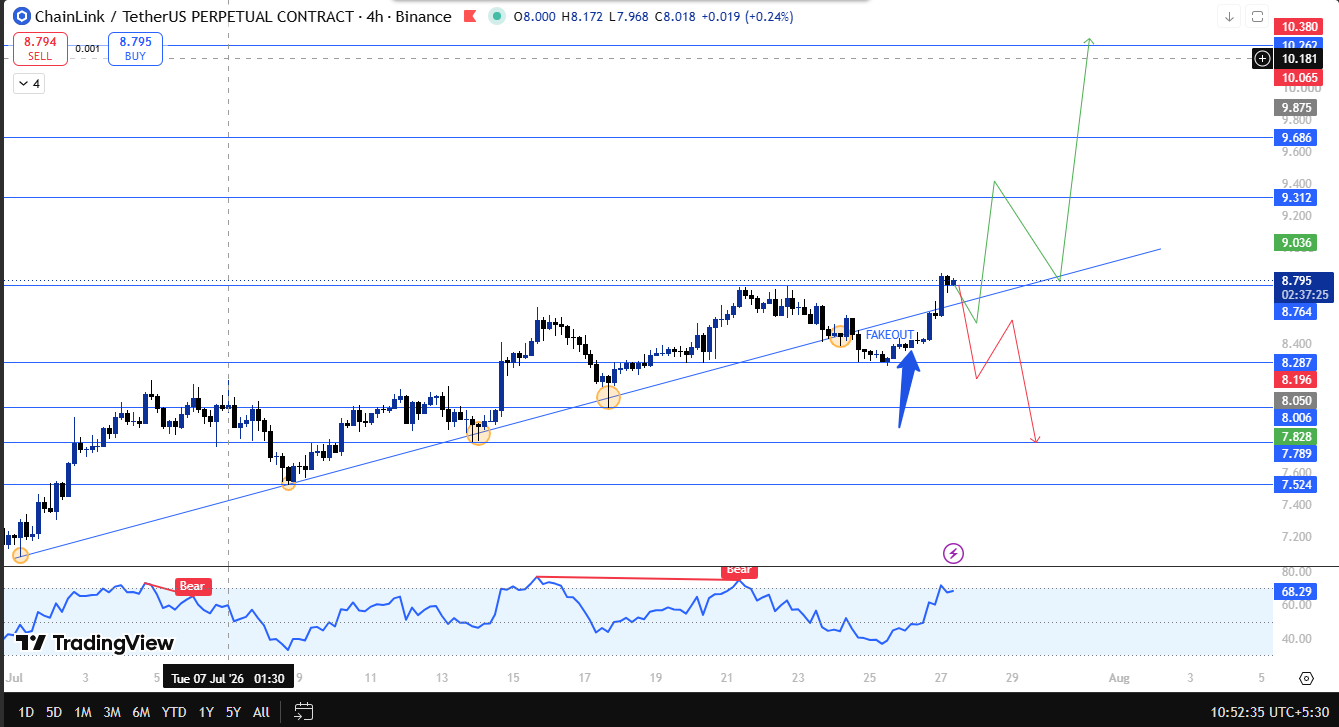
A trap is what showed up. Price dipped below the rising trendline just enough to shake out shorts before reversing hard, breaking its recent high, and closing above $8.764 to confirm the move was real rather than a wick.
LINK is now sitting just above that breakout zone.
A small pullback from here would not be unusual and would not damage the structure, and a fresh push higher could open the door toward $9.312, then $9.686, with $10.262 as the next stretch target if momentum holds; a continuation of our LINK integration boost breaks 10 coverage also outlines.
On the downside, if LINK breaks $8.287 and a 4-hour candle closes below it, that would undo the recent bullish structure and open $8.006 as the next support, with $7.789 as the level after that, a scenario tracked in our LINK trendline watch analysis.
The RSI on the 4-hour chart is sitting at 68.29, and there have been two earlier bearish divergence tags on this move, both of which the price simply climbed through.
That is a reminder that divergence alone has not been enough to stop this trend, though it is still worth watching for a possible cooling-off period around the current resistance shelf.
LINK Glossary Of Key Trading Terms
Ascending Trendline: A rising support line connecting a series of higher lows, used to track an uptrend's structure and spot where buyers keep stepping back in.
Bear Trap: A false breakdown below support or a trendline that quickly reverses higher, trapping short sellers who bet on further downside.
RSI (Relative Strength Index): A momentum indicator that measures how fast and how far price has moved, often used to flag overbought conditions or early divergence.
Liquidation: What happens when a leveraged trade gets forcibly closed because the trader ran out of margin to keep it open.
Open Interest: The total value of outstanding derivative contracts, used to gauge how much leverage is active in a market.
Spot ETF Inflow: Net money entering an exchange-traded fund, often read as a sign of growing institutional demand.
LINK Technical Snapshot Table
Indicator
Signal
Trend
The ascending trendline holding; bear trap flushed out shorts before a confirmed breakout
Structure
Trading above $8.764 after breaking the recent high, small pullback possible
RSI
At 68.29, two earlier bearish divergence tags absorbed by continued upside
Liquidations
Shorts overwhelmingly dominate liquidations across the 12h and 24h windows
Key Trigger
4h close above current levels opens $9.312 and $9.686; close below $8.287 flips bearish
Broader Catalyst
Steady LINK ETF inflows and record oracle transaction value support the setup
LINK Support And Resistance Levels To Watch
Type
Level
Note
Resistance 3
$10.262
Extended upside target
Resistance 2
$9.686
Next hurdle after $9.312 clears
Resistance 1
$9.312
Immediate resistance on continued momentum
Current Price
$8.795
Just above the confirmed breakout zone
Support 1
$8.287
Invalidation trigger on a confirmed close below
Support 2
$8.006
Next support if $8.287 breaks
Support 3
$7.789
Deeper cushion if the drop continues
Risk-Reward Table For LINK Traders
Case
Trigger
Target
Bull Case
Small pullback holds; fresh breakout continues
Push toward $9.312, then $9.686, extension to $10.262
Bear Case
4h close below $8.287
Drop toward $8.006, then $7.789
Invalidation Level For This LINK Setup
The bullish breakout structure on LINK stays valid as long as the price holds above $8.287 on a 4-hour closing basis.
A confirmed close below that level would undo the recent bullish continuation and shift focus toward $8.006 and then $7.789.
On the other side, holding the current breakout zone with a small pullback rather than a breakdown keeps the door open toward $9.312 and $9.686, with $10.262 as a further extension if buyers stay in control, a theme our LINK breakout change everything piece also covers.
Expert View On Chainlink Price Prediction
Traders following this Chainlink price prediction note that the bear trap play here is a textbook one, with shorts getting flushed right as the price reclaimed its recent high and closed above $8.764.
The scale of Chainlink's oracle network, now enabling $32.8 trillion in transaction value, combined with steady LINK ETF inflows, gives the move some fundamental backing beyond pure chart structure.
That said, the earlier RSI divergence tags are a reminder that momentum can cool off even inside a strong trend, and a small pullback here should not be mistaken for a reversal unless $8.287 actually gives way, a dynamic our $LINK retest before rally coverage and Chainlink price prediction double confirmation update both track closely.
Disclaimer: This technical analysis is for educational purposes only and shouldn't be treated as financial or investment advice. Crypto markets are highly volatile.