Chainlink price prediction is drawing fresh attention after LINK lost a trendline it had leaned on since early July, and the way it broke down is what has traders split on whether this is rea
Chainlink price prediction is drawing fresh attention after LINK lost a trendline it had leaned on since early July, and the way it broke down is what has traders split on whether this is real weakness or a shakeout before another push higher.
Institutional flows have also been quietly building in the background, which only adds to the tension around this level.
Quick Take: $LINK is trading near $8.304. This is a short-term read based on the 4-hour chart and becomes invalid after a confirmed 4-hour close if the price closes decisively beyond either $8.764 or $8.006.
Chainlink Price Right Now
Metric
Value
Price
$8.304
24h Change
-2.83% (-$0.2418)
Market Cap
$6.21B
Futures Volume (24h)
$201.90M
Spot Volume (24h)
$44.27M
Open Interest
$432.73M
Circulating Supply
748.09M LINK
Total Supply
1.00B LINK
Max Supply
1.00B LINK
Price is taken from thelive LINK chart on TradingView, with volume, market cap, open interest, and supply figures fromChainlink data on CoinGlass, as of July 25, 2026, around 12:40 PM IST.
Methodology And Data Sources
This Chainlink price prediction uses the 4-hour LINK/USDT chart on Binance via TradingView for price structure, with volume, open interest, and market cap figures from CoinGlass and liquidation flow from CoinGlass's LINK liquidation tracker.
All levels are treated as invalidated only on a confirmed 4-hour candle close beyond the stated trigger, not an intraday wick.
Institutional Flows Building Around $LINK
According to CoinGlass Spot ETF Flow data, spot LINK ETFs have recorded three consecutive sessions of positive net inflows after a long stretch of near-zero activity.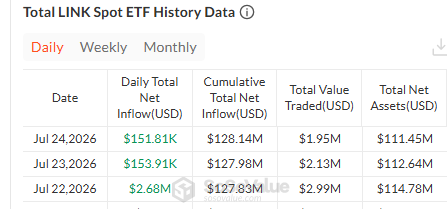
Daily flow data shows inflows of roughly $2.68M, then $153.91K, then $151.81K over three consecutive sessions, pushing cumulative net inflows past $128M and total net assets to around $111.45M as of July 24.
Arecent ETF inflow update flagged the products as up more than $2.83M on the week, ending a dry spell of over two weeks.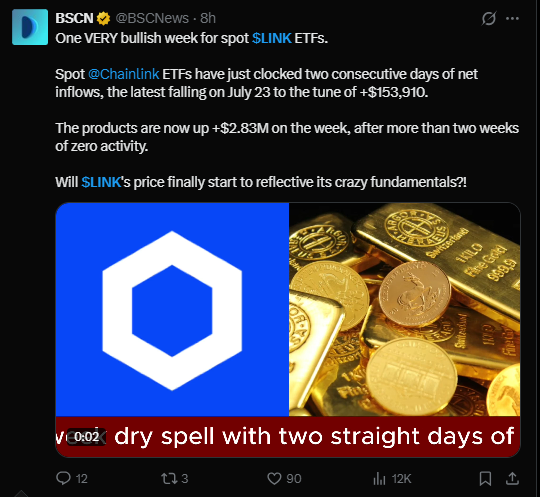
The full breakdown of daily and cumulative flows is tracked on the LINK spot ETF data page.
This kind of institutional buzz around $LINK does not override the short-term chart, but it is a backdrop worth keeping in mind while price works through this support zone.
Chainlink Liquidation Data Today
Liquidation activity over the past day is almost entirely one-sided.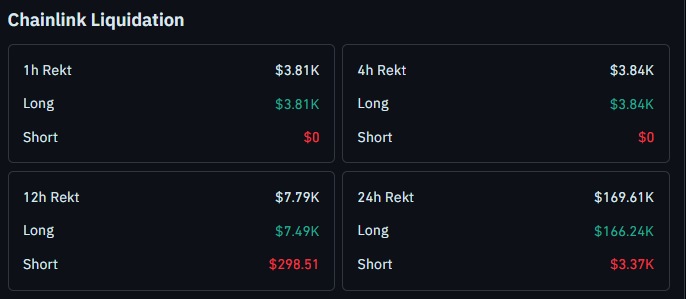
Over the past hour, $3.81K was liquidated, and all of it came from long positions, with zero short liquidations.
The 4-hour figure is nearly identical, $3.84K in total, again entirely from longs.
The wider windows keep the same tilt. Over 12 hours, total liquidations reach $7.79K, with $7.49K from longs and just $298.51 from shorts.
Across the full 24 hours, liquidations hit $169.61K, and longs account for $166.24K of that, while shorts make up only $3.37K.
That consistent long-side skew lines up with the trendline break, showing leveraged buyers got caught leaning the wrong way as sellers stepped in.
Chainlink Price Prediction: 4-Hour Chart Analysis
$LINK had been following an ascending trendline since early July, and that line did its job well, pushing price higher on four separate touches.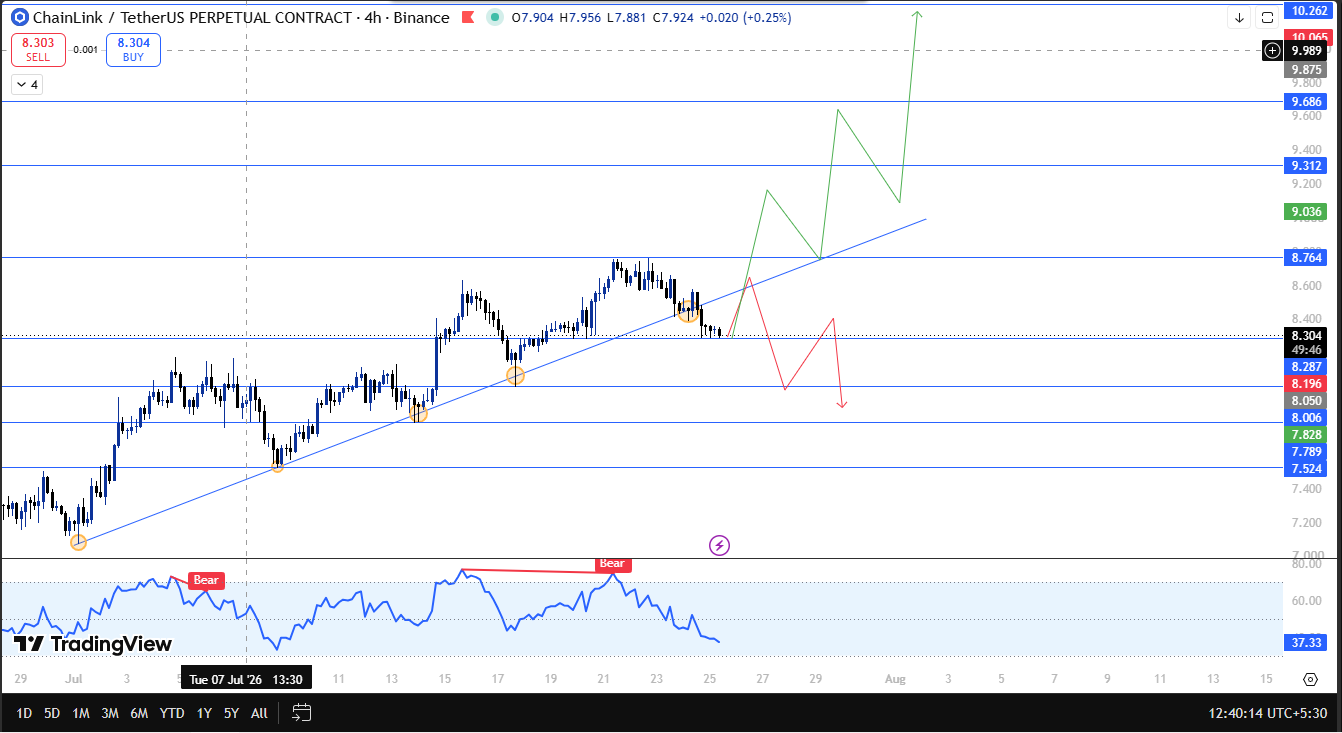
Each bounce off it added confidence that buyers were firmly in control, a setup covered in detail in ourLINK trendline watch piece as it was forming.
The fifth touch told a different story. Price initially found support there and even printed a large green 4-hour candle, the kind of move that usually signals continuation.
Instead, the very next candle saw sellers take over and drag price straight through the trendline, breaking a structure that had held for weeks.
Whether that turns into a genuine breakdown or plays out like theretest before rally setup we have tracked before is the key question right now.
The price is currently sitting around the support zone just below that broken trendline.
If $8.006 gives way and a 4-hour candle closes below it, the bullish scenario is invalidated, opening the door to $7.789 and then $7.524 as the next support levels.
If instead the price reclaims and closes a 4-hour candle above $8.764, that would be thebreakout that changes everything, with resistance building at $9.312, then $9.686 and $10.262 further out.
Chainlink Technical Snapshot
Indicator
Signal
Trend
Multi-touch ascending trendline broken after a fifth touch reversal
Structure
Price consolidating just below the broken trendline near support
Liquidations
Long liquidations dominate every window over the past 24 hours
Key Trigger
4h close below $8.006 invalidates; close above $8.764 reopens upside
Broader Catalyst
Spot $LINK ETF inflows building after a two-week dry spell
Chainlink Support And Resistance Levels To Watch
Type
Level
Note
Resistance 3
$10.262
Extended upside target
Resistance 2
$9.686
Next hurdle above $9.312
Resistance 1
$9.312
First target on a reclaim above $8.764
Reclaim Trigger
$8.764
4h close above needed to reopen the upside
Current Price
$8.304
Trading just below the broken trendline
Support 1
$8.006
Key support, invalidation trigger on a confirmed close below
Support 2
$7.789
Next support if $8.006 breaks
Support 3
$7.524
Deeper support level
Risk-Reward Table
Case
Trigger
Target
Bull Case
4h close above $8.764
Move toward $9.312, then $9.686, $10.262
Bear Case
4h close below $8.006
Slide toward $7.789, then $7.524
Invalidation Level
The near-term bullish structure for $LINK stays alive as long as price holds above $8.006 on a 4-hour closing basis.
A confirmed close below that level invalidates the setup and shifts focus toward $7.789 and then $7.524.
On the other side, a 4-hour close back above $8.764 would suggest the trendline break was a shakeout rather than a genuine breakdown, supporting thebullish breakout scenario toward $9.312 and beyond.
Chainlink Glossary
Ascending Trendline: A rising line connecting a series of higher lows, used to track the pace and structure of an uptrend until it breaks.Support Zone: A price range where buying pressure has historically stepped in, watched closely for signs of a bounce or a breakdown. Spot ETF Inflow: Net new money moving into a spot exchange-traded fund, often used as a gauge of institutional demand. Liquidation: What happens when a leveraged trade gets forcibly closed because the trader ran out of margin to keep it open. Open Interest: The total number of outstanding derivative contracts, used to gauge how much leverage is active in the market.
CoinGabbar's Technical Analyst View
Losing a trendline that held through four separate touches is not something to dismiss, especially with long liquidations dominating every timeframe over the past day.
That said, the large green candle right before the breakdown, followed by such a sharp reversal, has the hallmarks of a shakeout as much as a genuine trend change.
A 4-hour close below $8.006 would confirm sellers are in control and open $7.789 and $7.524 as next stops.
A close back above $8.764 would flip that read, supporting a move toward $9.312 and higher. Building spot ETF inflows add a constructive backdrop, but the next few 4-hour candles around current support will likely decide which way this resolves.
Disclaimer
This Chainlink price prediction is based on technical chart analysis and market data available at the time of writing. Cryptocurrency markets are highly volatile, and prices can change rapidly. This content is for informational purposes only and should not be considered financial advice. Always do your own research and consult a qualified financial advisor before making any investment decisions.