Chainlink price prediction interest is climbing fast, and it is easy to see why. Institutional money keeps finding its way into LINK, while the chart is winding itself into a tight spot that
Chainlink price prediction interest is climbing fast, and it is easy to see why. Institutional money keeps finding its way into LINK, while the chart is winding itself into a tight spot that rarely stays quiet for long.
One side of this setup could turn into a sharp move. Here is what the numbers say.
Editorial note: our desk holds no personal position in LINK. This is purely a chart and data read.
Chainlink Price Today: Live LINK Price and Market Data
Chainlink is trading at 13.967, down 0.87% over the last 24 hours. Market cap stands at 10.42B and open interest at 773.51M.
Futures volume reached 648.54M compared with spot volume of 115.83M, so leveraged traders are driving most of the activity.
The full 1.00B maximum supply is already fixed, with 748.09M LINK in circulation. For a comparable trendline read on another large cap, see our Cardano price prediction breakdown.
Source: CoinGlass, Sep 28, 2026
Chainlink News Today: Spot LINK ETFs Keep Absorbing Supply
A post from BSCN (@BSCNews) says another strong week has passed for the industry's suite of spot Chainlink ETFs, which took in an additional +$6.3M. 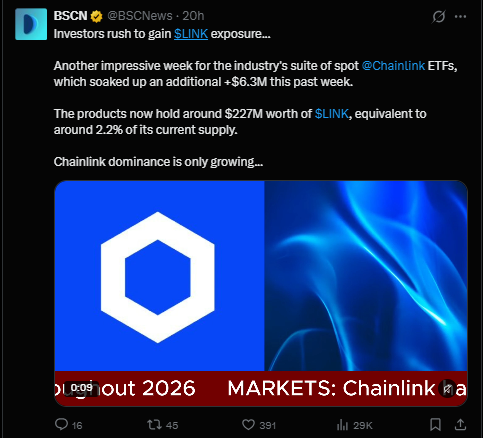
According to the post, these products now hold around $227M worth of LINK, roughly 2.2% of the current supply.
The author frames this as growing Chainlink dominance. ETF holdings are a steady, visible source of demand, though one weekly inflow does not guarantee a price response.
Readers following institutional flows can also read our crypto ETF inflows explained guide.
Source: BSCN (@BSCNews) X post, Sep 28, 2026, posted about 20 hours earlier
Quick Take
CMP: 13.969 (1-hour chart, Binance)
Bullish trigger: 1-hour close above 15.000
Failure level: 1-hour close below 13.498
Data timestamp: Sep 28, 2026, 10:28 UTC+5:30
Risk note: channels can break either way, so wait for the close.
Chainlink Price Prediction 2026 Technical Analysis
LINK had a strong run through the 25th and 26th, climbing from the 13.000 area to around 14.500 with steady higher lows. Since that peak, momentum has flipped into a slow bleed. 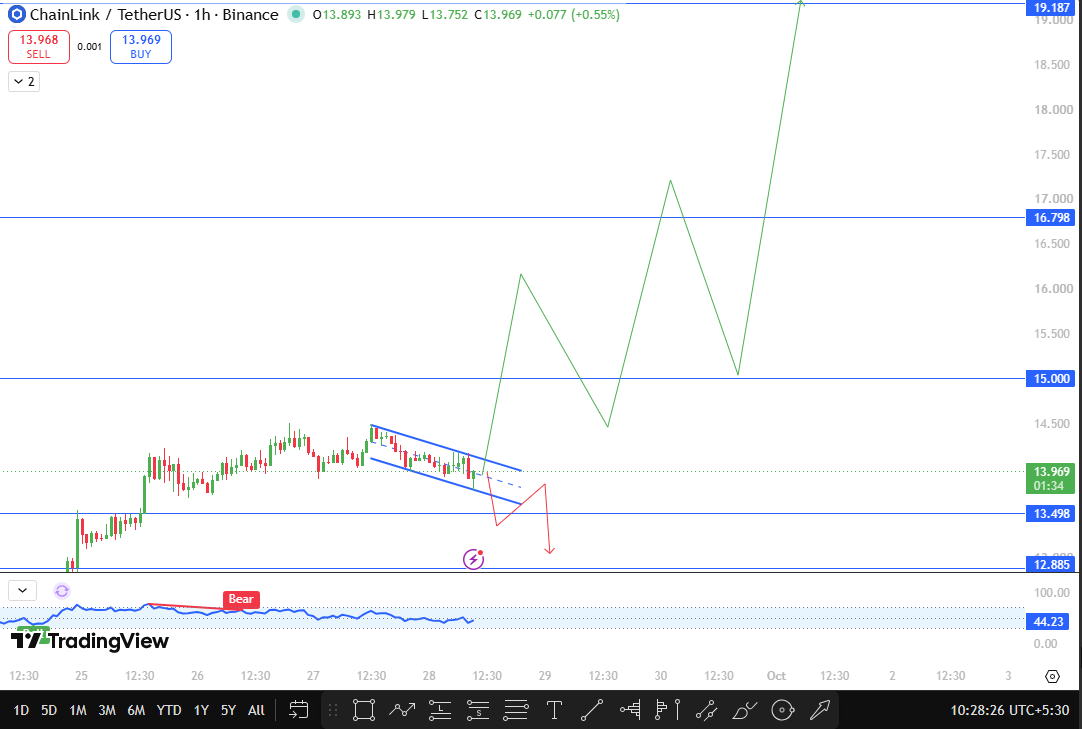
Price is now drifting inside a descending channel, printing a series of lower highs and lower lows that stack neatly between two parallel lines. The latest candle sits near the lower part of that structure at 13.969.
A descending channel on a 1-hour chart after a strong advance is often a pause rather than a reversal, but the chart still has to prove it.
The oscillator at the bottom reads 44.23, below its midline, and a bearish divergence label appeared near the recent peak, warning that the earlier push was losing strength before the pullback began.
Cooler momentum matches the sideways-to-lower drift, so buyers have not yet taken back control.
The bullish path starts with a break of the channel's upper edge, but the level that truly matters is 15.000.
A 1-hour close above it would turn a former ceiling into support and confirm a breakout from the whole corrective structure.
The next Chainlink resistance level is then 16.798, followed by 19.187 as the extended target on the chart.
The bearish path needs a 1-hour close below 13.498, a level that acted as support earlier in the move.
Losing it would break the lower channel boundary in convincing fashion and point toward 12.885 as the next LINK support level. A quick wick below with a close back inside would be a fakeout rather than a breakdown.
Source: TradingView, LINK/USDT, 1H, Binance, Sep 28, 2026, 10:28 UTC+5:30
Chainlink Support and Resistance Levels
Level
Type
Distance from CMP (13.969)
19.187
Extended resistance
+37.35%
16.798
Next resistance
+20.25%
15.000
Breakout trigger
+7.38%
13.498
Breakdown trigger
-3.37%
12.885
Next support
-7.76%
Bull, Base, and Bear Scenarios for LINK
Bull case. LINK pushes out of the channel, reclaims ground, and closes above 15.000 on the 1-hour chart. That would show buyers absorbing the recent selling, and ETF demand gives them a reason to stay committed.
From there, 16.798 becomes the first stop, and 19.187 comes into play if the move keeps its pace. Traders watching the wider market can check our Bitcoin price outlook this week.
Base case. Price keeps grinding lower inside the channel, testing the lower boundary without a decisive close below 13.498. Range trading around 13.500 to 14.500 is the most probable near-term outcome, since the channel is still intact and neither trigger has fired.
Bear case. Sellers force a 1-hour close under 13.498. That would drop LINK out of the structure that has held since the recent rally, with 12.885 as the next target. A weak bounce back toward the broken level would likely meet resistance.
Risks to Watch
Futures volume is more than five times spot volume, so liquidation-driven wicks can easily distort the channel edges.
ETF inflows of +$6.3M are modest next to the size of the market, and demand from funds can stall without warning.
A 1-hour chart also reacts quickly to headlines, which raises the odds of false breakouts. Broader sentiment, including our Hyperliquid price forecast update, can overpower any single-coin setup.
Chainlink 2030 Price Outlook
ETF products already hold around $227M of LINK, about 2.2% of supply, and that share only needs to grow for the supply picture to tighten.
With the 1.00B cap fixed and 748.09M in circulation, steady institutional buying has less to chew through each year. Our 2030 estimate for LINK is 40.
Glossary
Descending channel: two parallel downward-sloping lines that contain price action.
Bearish divergence: price rises while momentum weakens, hinting at fading strength.
Spot ETF: a fund that holds the actual asset rather than futures contracts.
Disclaimer
This article is for educational and informational purposes only and is not financial advice. Crypto assets are highly volatile. Do your own research before making any trading decision.