Is a falling wedge about to hand LINK buyers a lifeline or a trapdoor? The Chainlink price prediction hinges on that question at 05:54 UTC on November 3, 2026, with LINK at $11.09 and down 2.
Is a falling wedge about to hand LINK buyers a lifeline or a trapdoor?
The Chainlink price prediction hinges on that question at 05:54 UTC on November 3, 2026, with LINK at $11.09 and down 2.18% in a day. Price keeps squeezing into a narrowing tunnel. Earlier pressure points, like theRSI oversold breakdown, set the stage. The tilt stays bearish for now.
LINK Price Today Snapshot
Price, Volume, and Supply
The LINK price today sits at $11.09 on CoinMarketCap data, ranking 14th. The 24-hour range ran from $11.00 to $11.39.
Volume rose 9.21% to $294.07M against an $8.3B market cap. That's a 3.55% turnover ratio, a quick read on how busy trading is. Circulating supply is 748.09M of a 1B max.
Weakness is short and sharp. LINK is down 2.31% over 7 days and 21.26% over 30. But 90 days still show +36.51%, and 180 days sit at +11.21%.
Bearish felt like the easy call until that number showed up, and the picture softened a bit. Not enough to flip the stance, though. A wider sell-off context sits in themarket dip outlook.
LINK Technical Analysis Through the Wedge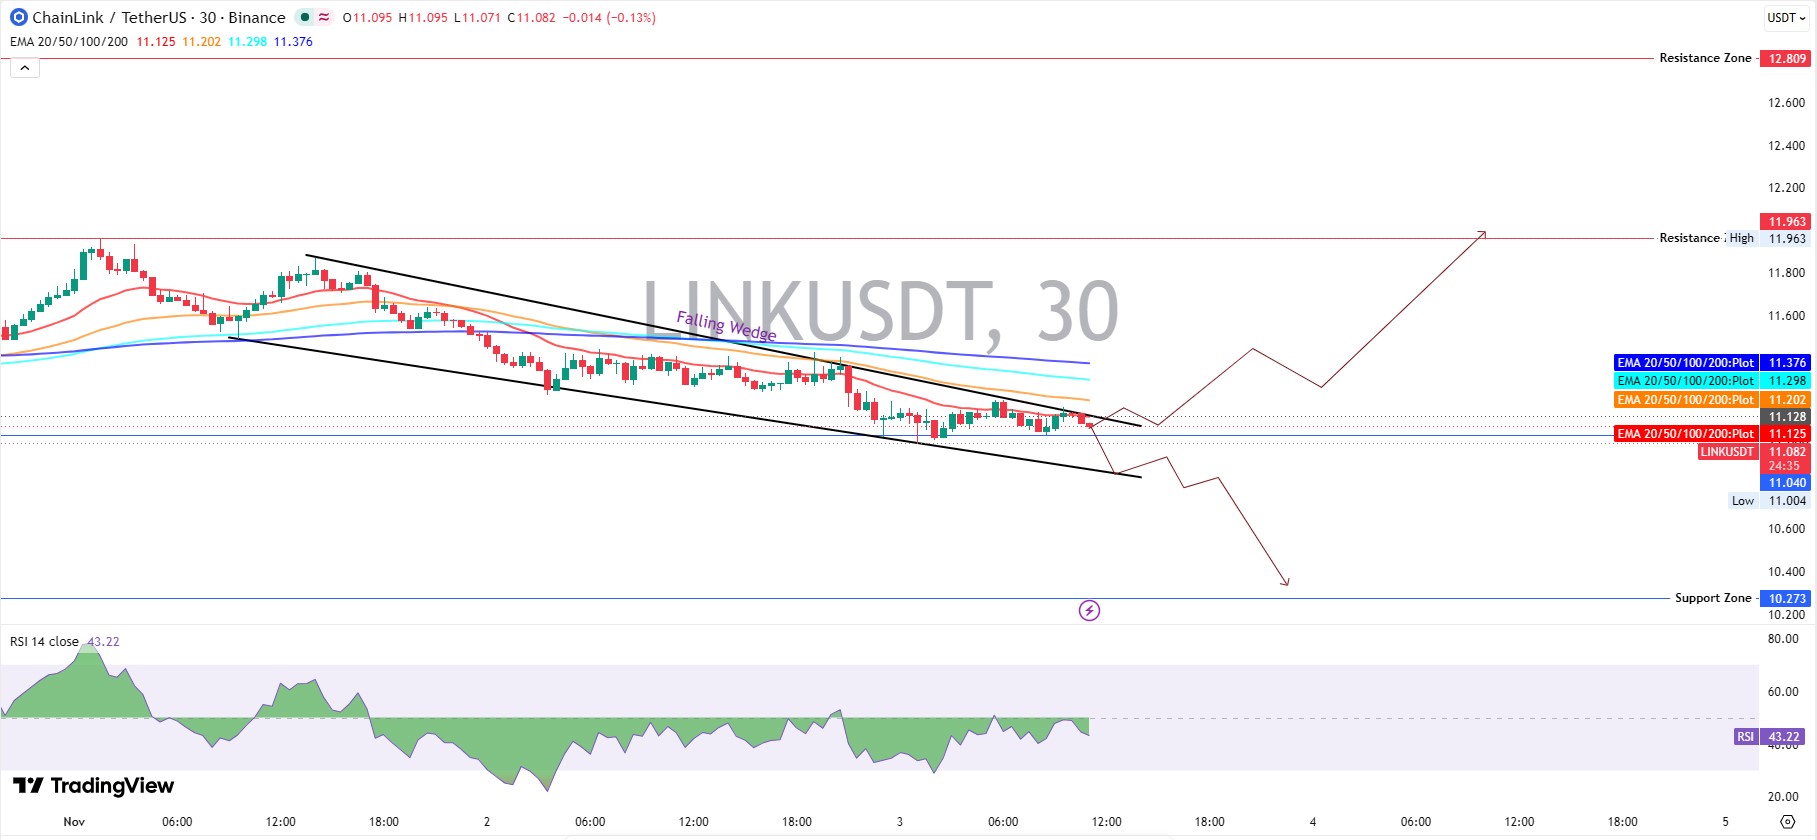
Walking Into the Wedge
Price has been walking down a tunnel on the 30-minute TradingView chart, where two walls slope lower and squeeze together. That shape is a falling wedge, and it usually ends with a sharp break.
LINK trades at $11.082, pressing the upper wall. Overhead, a stack of 4 EMAs. Those are exponential moving averages that weight recent prices, climbing from the 20 EMA at $11.125 to the 50 EMA at $11.202, the 100 EMA at $11.298, and the 200 EMA at $11.376.
RSI reads 43.22. Sellers lead. But they aren't exhausted.
Chainlink Support Levels
Chainlink support and resistance start underneath. Price walks toward the $11.00 floor first, tested more than once on this chart, and $10.273 waits about 7.4% lower.
Bounces from floors happen, like thereserve buy bounce.
Chainlink Resistance Levels
Buyers meet $11.376 first, where the 200 EMA caps the stack. Then $11.963, 7.9% above spot, and $12.809 at +15.5%.
The$12.47 channel breakout shows how stubborn ceilings get.
Chainlink Futures Positioning Turns Risky
Long Liquidations Hit Hard
Longs got hit. Hard.CoinGlass liquidation data shows $723.89K wiped out in 24 hours, and $708.15K of it was longs.
Open interest, the total of live futures contracts, sits at $535.48M. Futures volume is $485.12M against $86.65M in spot. Binance accounts run 1.956 longs per short, and OKX 2.12.
With longs nearly 2 to 1 over shorts, who's left to buy a dip? A drop under $11.00 would force more exits.
Chainlink Whale Holders and ETF Demand
Whale Concentration
Etherscan holder data counts 914,859 holders. Of those, 3,943 whales (wallets holding huge amounts) make up 0.43% of wallets yet hold 90.42% of the market cap tier.
Much of that isn't sell pressure. The community staking pool holds 4.0876%, and several noncirculating supply wallets hold 3% each. Binance Cold Wallet 28 holds 3.2694%.
ETF Demand
Chainlink ETF flows went quiet.SoSoValue ETF data shows $0.00 daily net inflow at the latest update, with cumulative inflow at $177.46M and total net assets at $193.64M, or 2.29% of market cap.
Grayscale's GLNK holds $138.18M, and Bitwise's CLNK holds $55.45M. Demand isn't leaving. But it isn't buying either.
Chainlink Price Prediction Scenarios
The table maps the next 7 to 30 days, in the spirit of thePolymarket channel test.
Scenario
Trigger
Target
Invalidation
Liquidity Condition
Bear
Trades below $11.00 with rising volume
$10.273
Reclaim of $11.202 (50 EMA)
Long liquidations rise, spot stays thin
Base
Holds $11.00 to $11.376 inside the wedge
$11.00 to $11.376 range
Break of either edge
Volume near $294.07M, flat ETF flows
Bull
Breaks the wedge and holds above $11.376
$11.963, then $12.809
Falls back under $11.125 (20 EMA)
Spot buying leads, ETF inflows return
Bear Case
Bearish is the lead call. Price sits under all 4 EMAs, from $11.125 up to $11.376, so recent buyers are holding losses and every bounce runs into sellers trying to exit at break-even. Longs are crowded too, and RSI at 43.22 has room to fall. This Chainlink price prediction targets $10.273 if $11.00 breaks on rising volume.
Base Case
Chop is the middle road. LINK drifts between $11.00 and $11.376 while the wedge tightens. Boring, sure. But tradeable.
Bull Case
Falling wedges tend to break upward, which keeps buyers in the game. A hold above $11.376 opens to $11.963, then $12.809. And ETF inflows would need to turn positive for that run to last.
Chainlink Price Forecast for 7 to 30 Days
The Chainlink price forecast for this week favors range trading between $11.00 and $11.376 unless the wedge snaps. Over 30 days, $11.963 is the line that matters, and adoption headlines like theLG CNS partnership need volume behind them.
Risks That Could Change the Chainlink Price Prediction
A long squeeze under $11.00, an upside wedge break, a whale wallet move, and stalled ETF demand each flip the setup. More coin setups sit in thecrypto price predictions hub.
Final Takeaway
Bearish below $11.376. Neutral between $11.00 and $11.376. And the first real shift in this Chainlink price prediction comes on a hold above $11.376, not before.
Disclaimer: This Chainlink price prediction is for information only and isn't financial advice. Crypto prices swing fast, and scenarios aren't guarantees. Research independently before any trade.