Can a regulator's keynote and an Abu Dhabi compliance deal push this coin past $12? This Chainlink price prediction leans bullish, while $LINK trades above $11.56 on October 28, 2026, 06:30 U
Can a regulator's keynote and an Abu Dhabi compliance deal push this coin past $12?
This Chainlink price prediction leans bullish, while $LINK trades above $11.56 on October 28, 2026, 06:30 UTC. Theearlier November outlook drew a wider range, but the hourly chart has moved on.
Binance's hourly candle reads $11.726, only $0.037 under the 200 EMA, a moving average of recent trades, at $11.763. That line keeps turning the price away.
And Link: NYC starts on October 29, 2026.
$LINK Price Today: Market Snapshot
The $LINK price today is $11.70, up 3.38% in 24 hours as of October 28, 2026. Chainlink ranks 13th with an $8.75B market cap.
Volume is softer. CoinMarketCap $LINK data shows $225.75M traded, down 17.57%.
Why LINK Is Moving Today?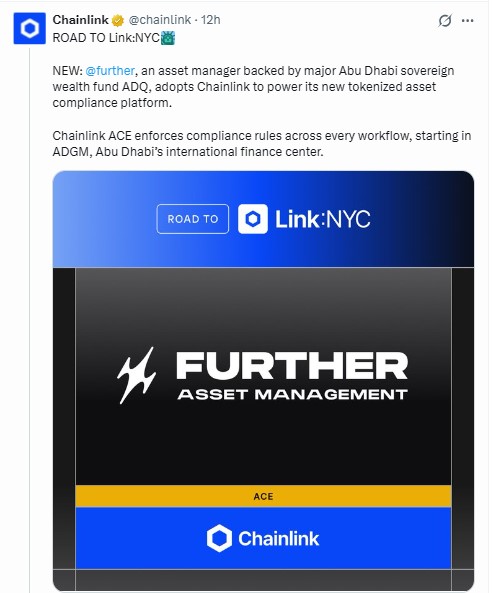
Breaking. Further, an asset manager with ADQ backing just adopted Chainlink ACE for a tokenized asset compliance platform.
ADQ is an Abu Dhabi sovereign wealth fund. The rollout starts in ADGM, the emirate's finance center.
Price is up. Volume isn't. Nobody rushed in, perChainlink's Further announcement.
Link: NYC and the Selig Keynote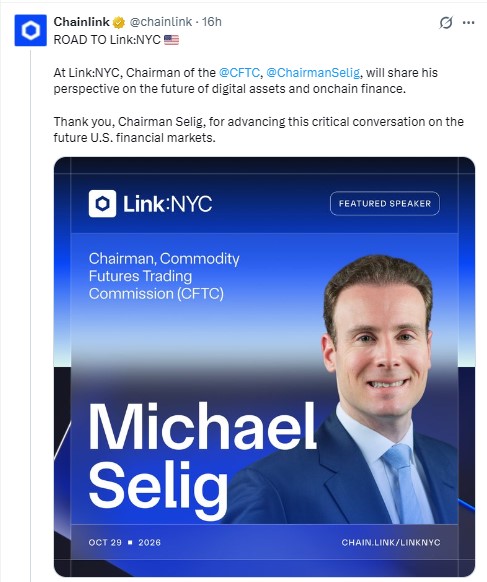
CFTC Chairman Michael Selig speaks at Link:NYC on October 29, 2026, about digital assets and on-chain finance.
The CFTC regulates American commodity futures, so institutions listen. Whenever traders buy a speech before it happens. Selling the speech is common, perChainlink's Selig announcement.
Chainlink Technical Analysis on the Hourly Chart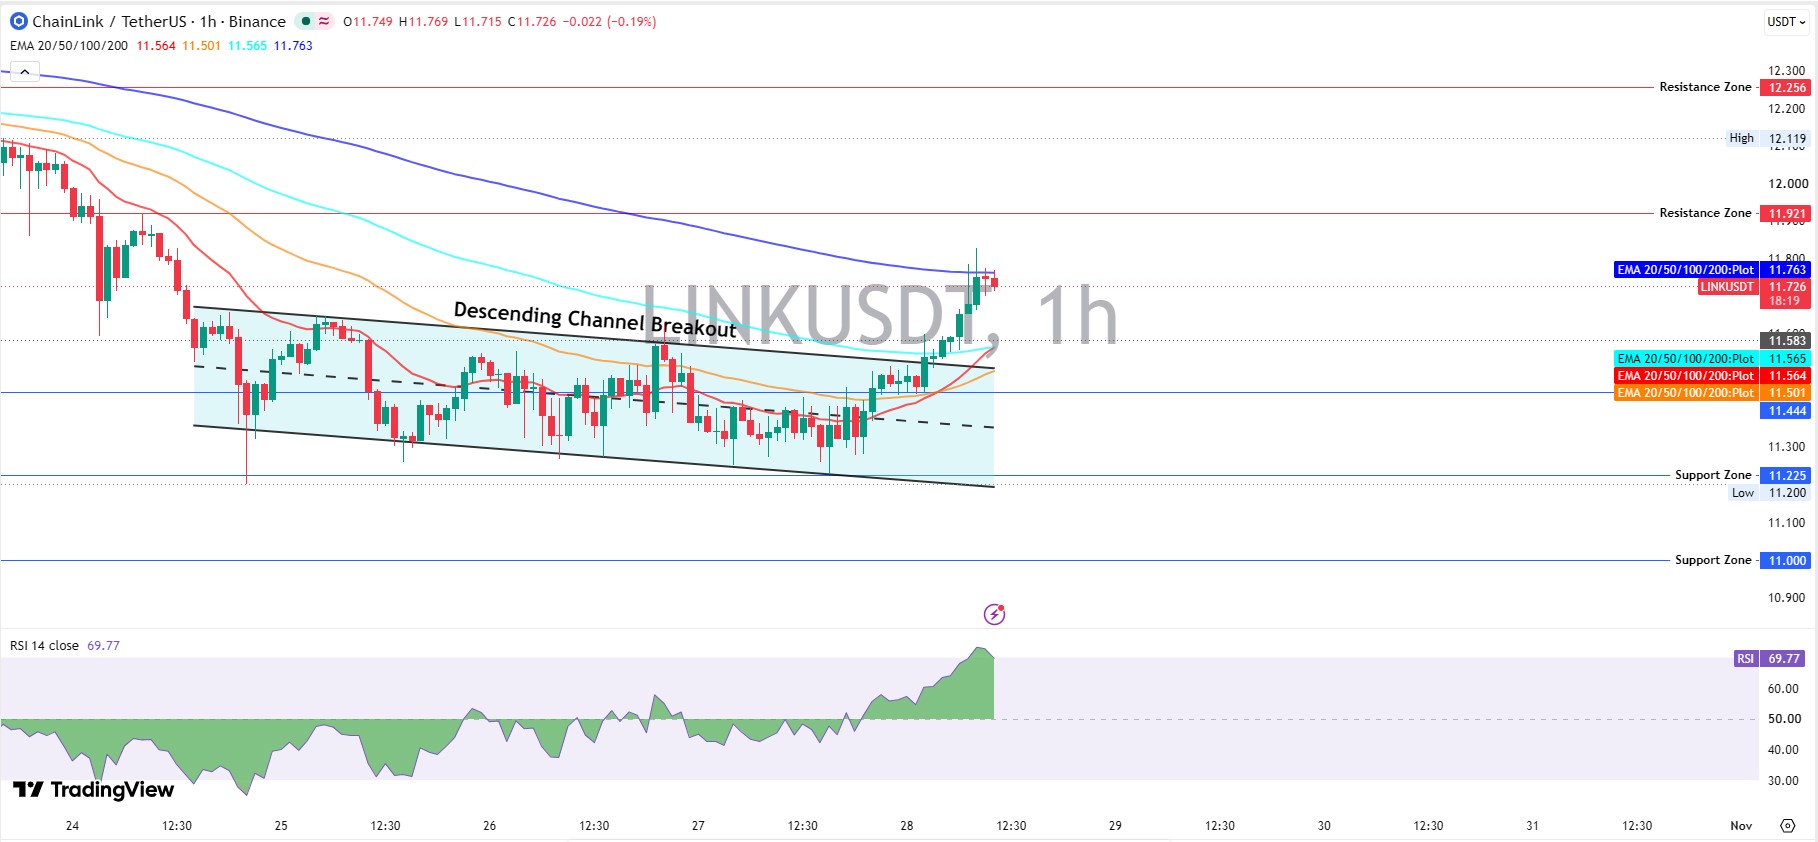
This Chainlink technical analysis uses the TradingView LINKUSDT chart on Binance. Since October 24, 2026, the price has slid inside a descending channel. Buyers then forced a descending channel breakout from $11.20 to $11.77.
The 200 EMA Wall
The 20 EMA sits at $11.564, the 50 EMA at $11.501, the 100 EMA at $11.565, and the 200 EMA at $11.763.
A cross of the 20 EMA above the 50 EMA is an early bullish sign. If buyers hold an hourly trade above $11.763. That's the first real confirmation, since a similarchannel breakout setup peaked near $12.44 on October 21, 2026, then faded.
RSI Is Nearly Overbought
RSI, a momentum gauge from 0 to 100, reads 69.77. Above 70 counts as overbought, meaning strong momentum and higher pullback risk.
But overbought isn't a sell signal. Momentum seems strong, so bullish feels right. Actually, scratch that. Constructive fits better under the 200 EMA, and theRSI oversold breakdown covered the opposite extreme.
LINK Support and Resistance Levels
Support
Support is a floor where buyers stepped in before. The nearest sits at $11.583, 1.0% below spot.
Next comes $11.444, then the channel floor at $11.225. But a trade under $11.444 flips the bias, and thereserve buy bounce showed how buyers react at floors.
Resistance
Resistance is a ceiling where sellers pushed the price back before. The 200 EMA at $11.763 comes first, then $11.921, 1.9% above $11.70.
Should $11.921 give way to rising volume? Then $12.119 and $12.256, 4.8% higher, come into range. Catalyst stories like theJapan Fulcrum news still need volume.
LINK ETF Flows Stay Flat
LINK ETF flows printed $0 on October 27, 2026, the 7th flat session, since a $397.26K outflow on October 16, 2026.
Net assets sit at $203.40M, perSoSoValue spot ETF data.
And funds aren't helping. So who's buying a rally that volume doesn't back?
Whale Wallets and Holder Concentration
Etherscan LINK holder data counts 4,078 whale-tier wallets, meaning the biggest balances. That's 0.45% of holders controlling 90.61% of market cap.
But a big wallet isn't a seller by default. The Community Staking Pool alone holds 40.88M LINK, or 4.09%.
Chainlink Price Prediction Scenarios
This Chainlink price prediction stays bullish above $11.564.
Scenario
Trigger
Target
Invalidation
Liquidity Condition
Bull
Hourly trade above $11.763
$11.921, then $12.119
Under $11.564
Volume above $225.75M
Base
Range of $11.564 to $11.763
Same range
Either edge breaks
Volume near $225.75M
Bear
Hourly trade under $11.444
$11.225, then $11.00
Reclaim of $11.564
Thin volume, ETF flow at $0
Can LINK Reach $12?
A move to $12 needs 2.6% from $11.70 through $11.763 and $11.921 on volume above $225.75M.
Odds favor a test of $11.921 by October 29, 2026 UTC. A hold above $12 needs a catalyst like theLG CNS partnership.
LINK Price Forecast by Timeframe
Before the Keynote
This LINK price forecast fits $11.56 to $11.92 through the rest of October 28, 2026.
Keynote Day
On October 29, 2026, speeches bring volatility. The base target is $11.921, with $12.119 as the stretch.
The Week After
Through November 5, 2026, a hold above $11.763 opens $12.256. But a fade sends the price to $11.444, and themarket dip outlook explains why altcoins fall early.
Risks That Could Change the Chainlink Price Prediction
Weak volume is the first risk, down 17.57% on a green day. ETF demand at $0 is the second. And a flat speech could turn event buyers into sellers.
A few large wallets can push thin books, as thewhale holders analysis explained.
Bottom Line on LINK
Bullish above $11.564, with $11.921 first and $12.119 next. Bearish below $11.444, with $11.225 as the target.
This Chainlink price prediction hinges on an hourly trade that holds above $11.763. Whether Selig's speech supplies the push is something only the next candles can answer.
Disclaimer: This article is for information only and isn't financial advice. Crypto prices swing fast, and scenarios aren't guarantees. Research independently before any trade.