Markets3 min read
Binance Futures Lists CAP
Binance Futures has listed CAP, adding a perpetual contract for the token on the world's largest cryptocurrency derivatives exchange. The listing expands derivatives access for CAP and puts i
Key Highlights Chainlink (LINK) is trading at $7.37 — down -13.44% over 90 days and -39.53% year-to-date — with a market cap of $5.35 billion, even as on-chain data signals renewed underlying
Key Highlights
Chainlink (LINK) is currently trading at $7.37, down 13.44% over the past 90 days and 39.53% year-to-date, with a market capitalization of $5.35 billion.Despite the price pressure, on-chain data shows strong underlying activity that could set the stage for a recovery.
 Chainlink (LINK) Price on 27 June 2026/Source: Coinmarketcap
According to on-chain analytics platform Santiment, Chainlink has just recorded its two highest network growth days of 2026 — back-to-back, in consecutive sessions:
DateNew LINK WalletsJune 253,142June 263,040
These two days represent the strongest wallet creation seen all year for Chainlink — a meaningful statistic given that LINK has spent much of 2026 under sustained price pressure, down nearly 40% year-to-date.
Why this pattern matters: Santiment notes that this specific kind of surge in new address creation, occurring during a period of weak price action, often signals quiet accumulation and growing confidence among new users — rather than the kind of speculative, momentum-chasing wallet activity that typically accompanies a rallying price. New users entering specifically while the price is depressed suggests a degree of conviction that the asset represents value at current levels, independent of short-term price momentum.
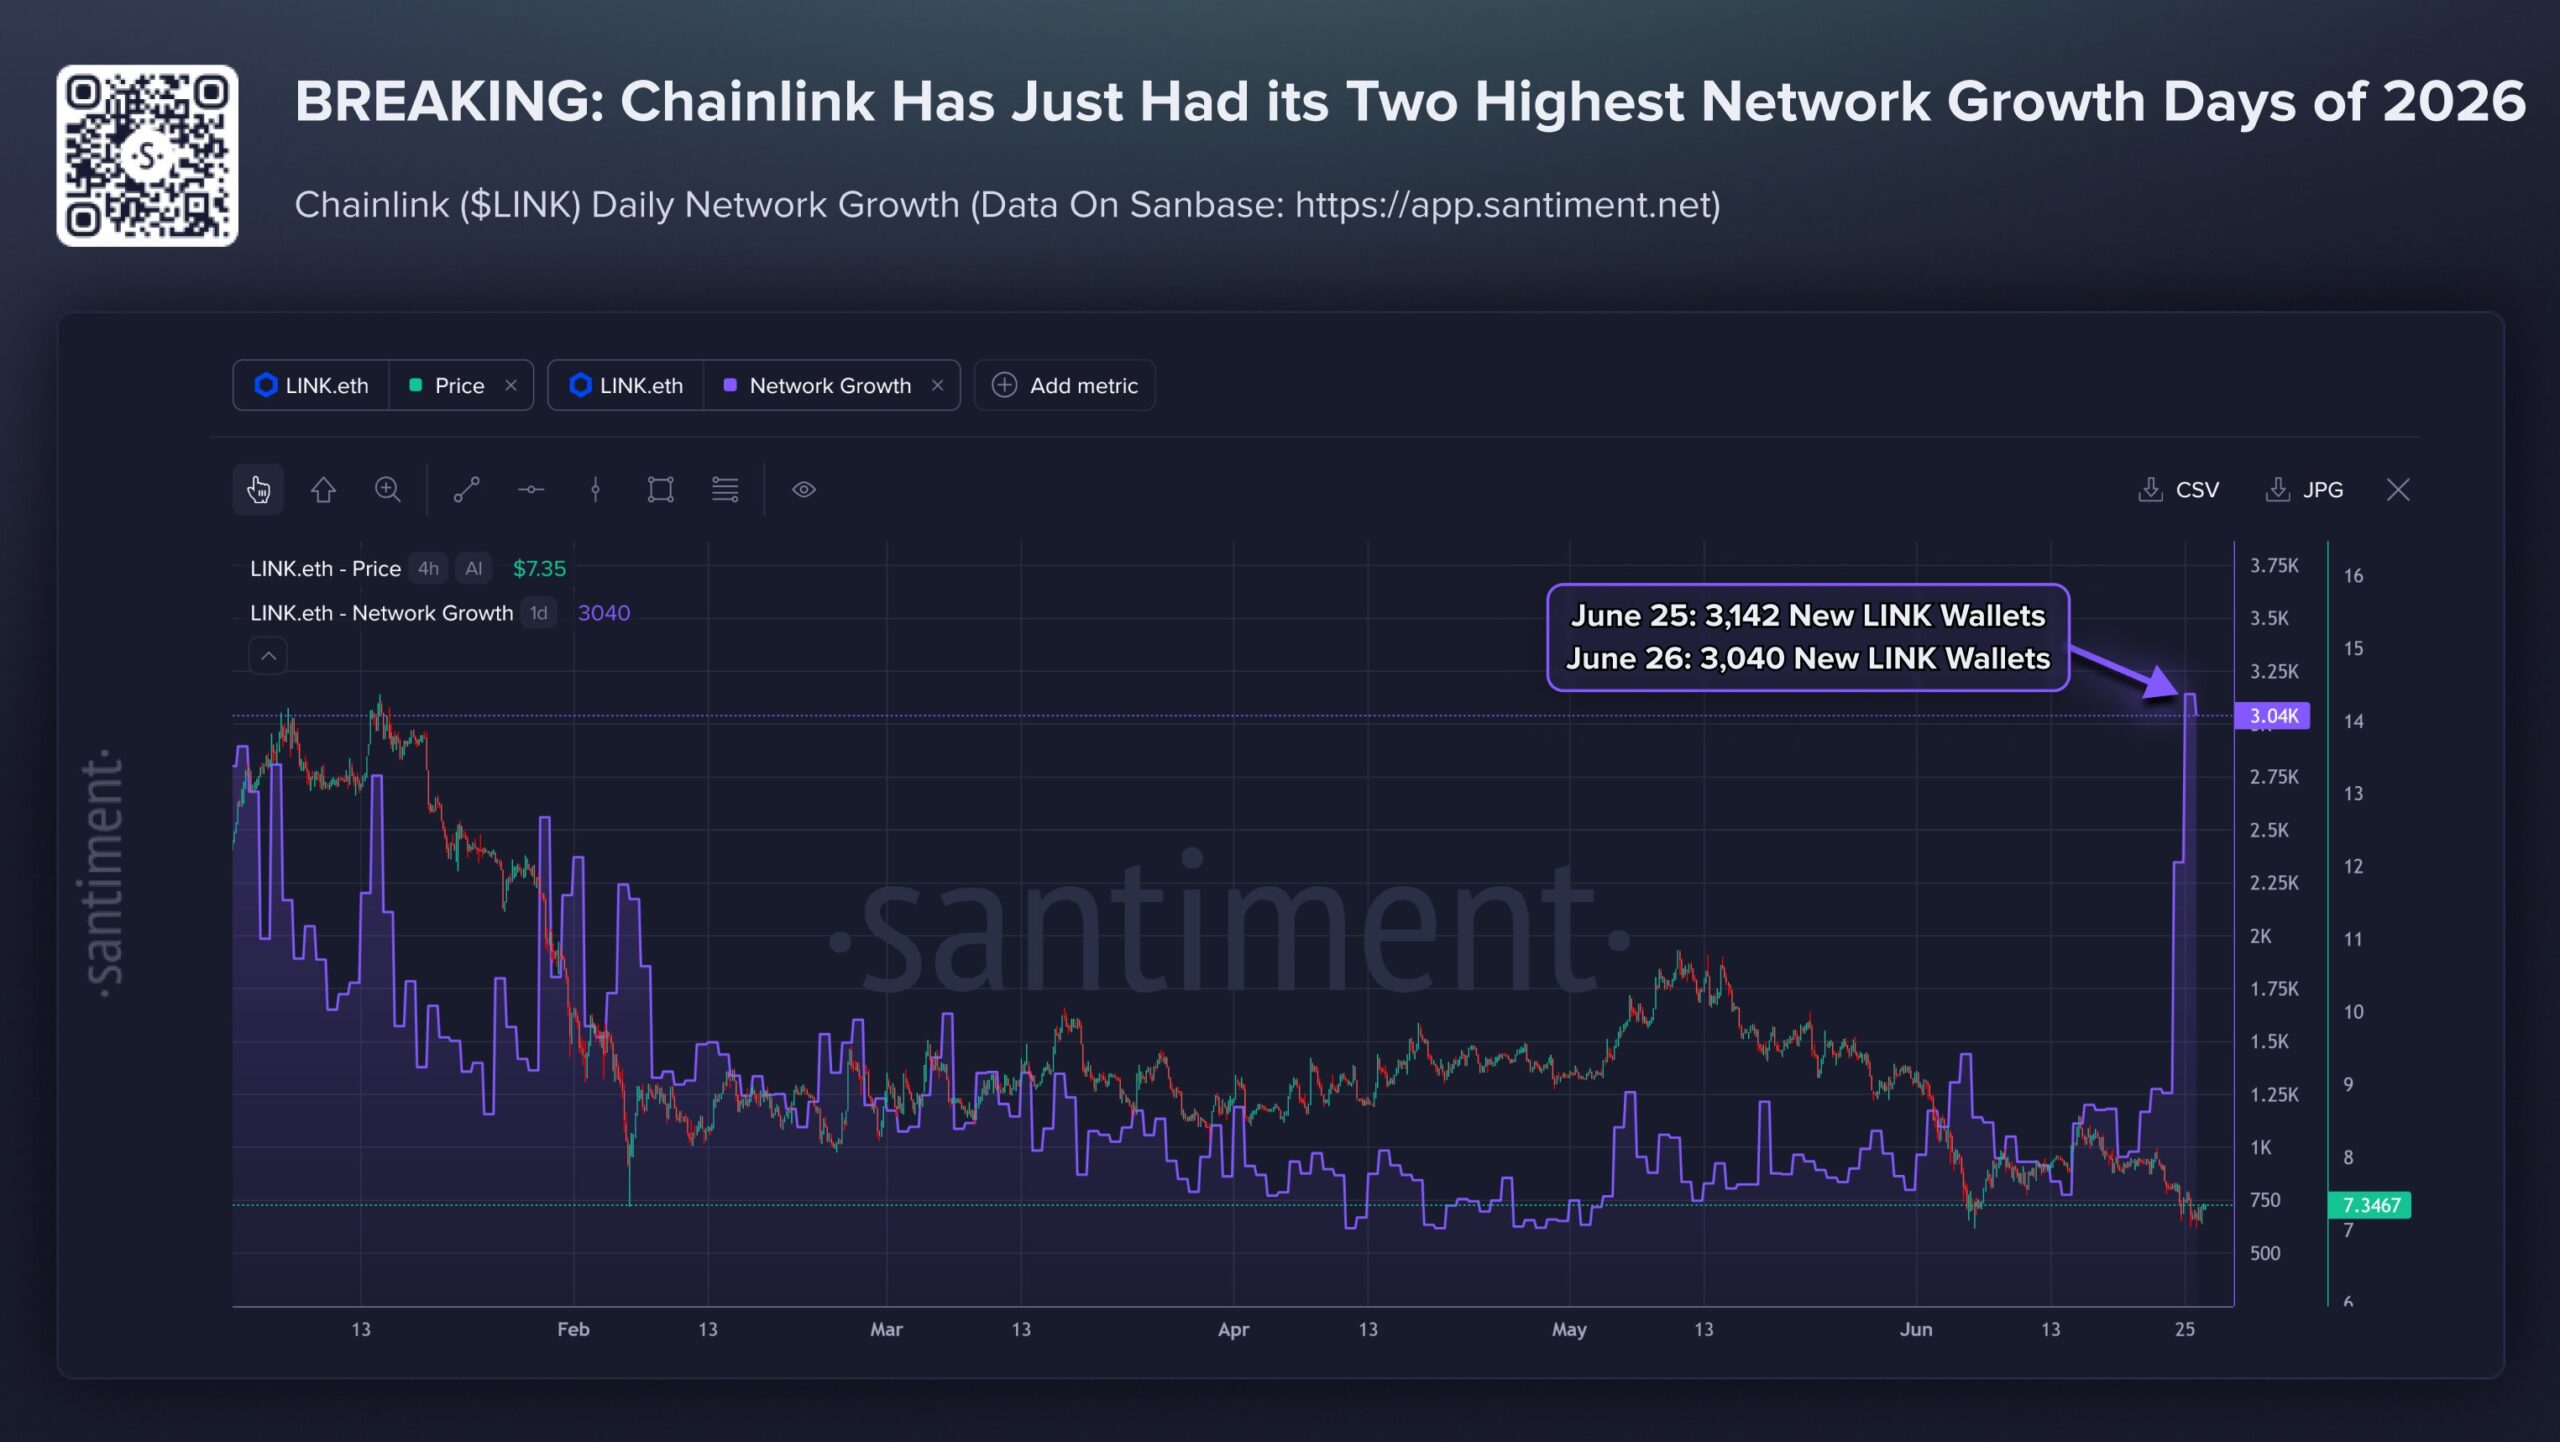 Chainlink Network Growth/Source: @SantimentData (X)
The surge in new wallet creation is not occurring in a vacuum — it coincides with Chainlink’s expanding institutional narrative, which has been building steadily across several distinct fronts:
Project Pangea — Chainlink’s broader institutional infrastructure initiative, positioning the network as critical plumbing for traditional finance institutions exploring blockchain-based settlement and data infrastructure.
Tokenized asset settlement solutions — As we have covered extensively throughout 2026 with Coinbase’s tokenized US stocks announcement and the broader RWA tokenization wave, the infrastructure required to settle tokenized assets reliably and securely is becoming increasingly valuable — and Chainlink has positioned itself as a core settlement layer for this emerging category.
24/5 equity data streams — Providing continuous, near-real-time pricing data for traditional equities directly on-chain — a capability that becomes increasingly important as more tokenized stock products, like those we’ve covered from Coinbase, require reliable price feeds to function correctly.
Growing role as critical on-chain finance infrastructure — Beyond any single product, Chainlink’s broader positioning as foundational “oracle” infrastructure — the layer that connects on-chain smart contracts to real-world data — continues to deepen as the on-chain finance ecosystem expands across tokenized stocks, RWAs, and DeFi more broadly.
This combination of institutional-grade infrastructure narratives appears to be the underlying driver attracting the wave of new wallet creation, even as the broader market continues pricing LINK conservatively based on near-term price action alone.
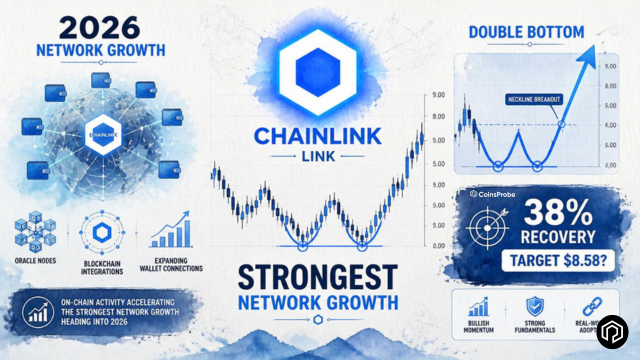
On the daily chart, LINK is showing the early stages of a double bottom pattern — one of the more recognisable and historically reliable reversal structures in technical analysis.
The pattern structure:
LINK made a second bottom near the $7.00 support level — a level that had previously held during an earlier test, and which buyers have now defended a second time. Following this second test, buyers have stepped in, with LINK currently trading around $7.36 — consistent with the kind of bounce that typically follows a confirmed double bottom’s second low.
The neckline resistance:
The pattern’s neckline sits at approximately $8.58 — this is the critical level that needs to be decisively cleared for the double bottom to be considered confirmed and for the pattern’s full measured move to activate.
 Chainlink (LINK) Daily Chart-Coinsprobe/Source: Tradingview
If the pattern plays out as a classic double bottom reversal:
LevelSignificance$7.36Current price$8.58Neckline resistance — breakout trigger$10.16Measured move target+38%Upside from current levels to target
A confirmed breakout above the $8.58 neckline — ideally on strong volume and with a sustained close rather than a brief wick above the level — would open a path toward the $10.16 measured move target, calculated using the standard double bottom methodology of projecting the pattern’s height above the breakout point.
From the current price of $7.36, a move to $10.16 represents approximately +38% upside — a meaningful potential recovery that would also substantially reduce LINK’s year-to-date losses if achieved.
Technical patterns require clear invalidation criteria, and the double bottom here is no exception:
A daily close below $7.00 would invalidate the double bottom structure entirely. This specific level matters because it represents the support that has now been tested twice — a clean break below it on a closing basis (rather than just an intraday wick) would suggest the support has genuinely failed rather than simply being retested, opening the door for further downside beyond the pattern’s current structure.
Chainlink’s price remains under pressure — down nearly 40% year-to-date — but the underlying on-chain picture is telling a more constructive story. The two highest network growth days of 2026, occurring back-to-back on June 25 and June 26, suggest genuine new user accumulation happening quietly beneath a depressed price.
Combined with a developing double bottom pattern on the daily chart — a confirmed second test of $7.00 support followed by a bounce toward the $8.58 neckline — LINK could be setting up for a meaningful recovery toward $10.16 if the pattern completes with a decisive breakout.
Watch the $8.58 neckline for confirmation, and watch $7.00 as the level that must hold to keep the bullish structure intact. The combination of expanding institutional infrastructure narratives and record wallet creation gives this particular setup more substance than a purely technical pattern in isolation.
Disclaimer: The views and analysis presented in this article are for informational purposes only and reflect the author’s perspective, not financial advice. Technical patterns and indicators discussed are subject to market volatility and may or may not yield the anticipated results. Investors are advised to exercise caution, conduct independent research, and make decisions aligned with their individual risk tolerance.
Read Also:Autheo Presents ETHToronto 2026, Bringing Builders Together to Shape the Future of Web3 & AI