The Bitcoin price is back around $63,400. The chart is asking a simple question. Is this the bottom? Or is there more pain coming? Look at the daily chart. BTC fell from that May top near $83
The Bitcoin price is back around $63,400. The chart is asking a simple question. Is this the bottom? Or is there more pain coming?
Look at the daily chart. BTC fell from that May top near $83,000. Ever since, it has not been able to break above that $67,000–$68,000 zone. The weekly chart looks worse. Bitcoin is stuck under $68,000 and way off that $83,000 high.
But here is the thing. Buyers did step in back in July when it dropped toward $58,000. They have been defending $60,000 ever since. That keeps the door open for a bounce.
So this week matters. If the Bitcoin price takes back $68,000, the recovery story gets stronger. If it loses $60,000, we are looking at lower levels again.
The Prompt: What We Actually Asked ChatGPT
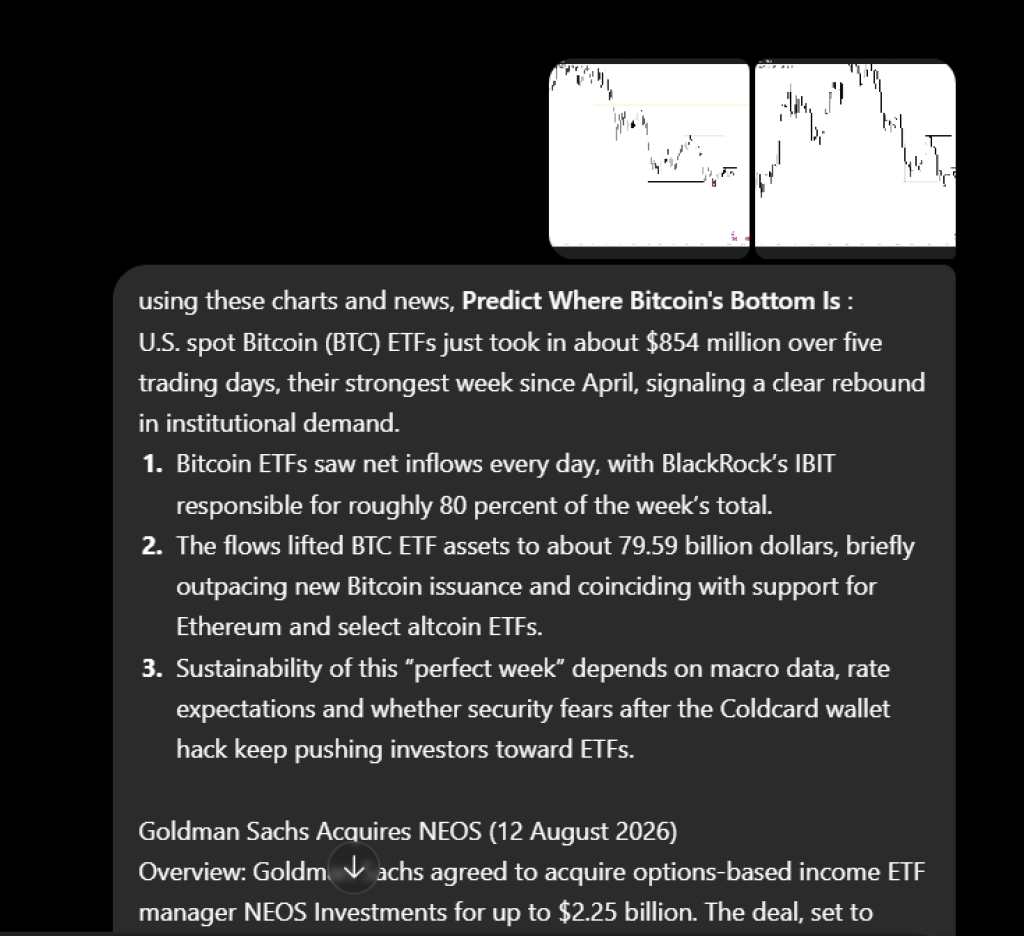
The question was simple: using the latest Bitcoin charts, market flows, macro conditions and historical cycle data, where could BTC find its next major bottom?
The analysis did not assume that the July low near $58,000 was automatically the final floor. Instead, it weighed the support levels visible on the weekly chart against current institutional demand and liquidity conditions.
 Source: ChatGPT
The analysis also incorporated the latest U.S. spot Bitcoin ETF flows. The funds attracted $853.5 million across five consecutive trading sessions from August 3–7, their strongest weekly inflow since April.
The prompt also included the latest macro risks, including U.S. CPI data, PPI due next and geopolitical uncertainty. That matters because Bitcoin’s next major move could depend heavily on interest-rate expectations and available liquidity rather than technical levels alone.
ChatGPT’s Bitcoin Bottom Prediction
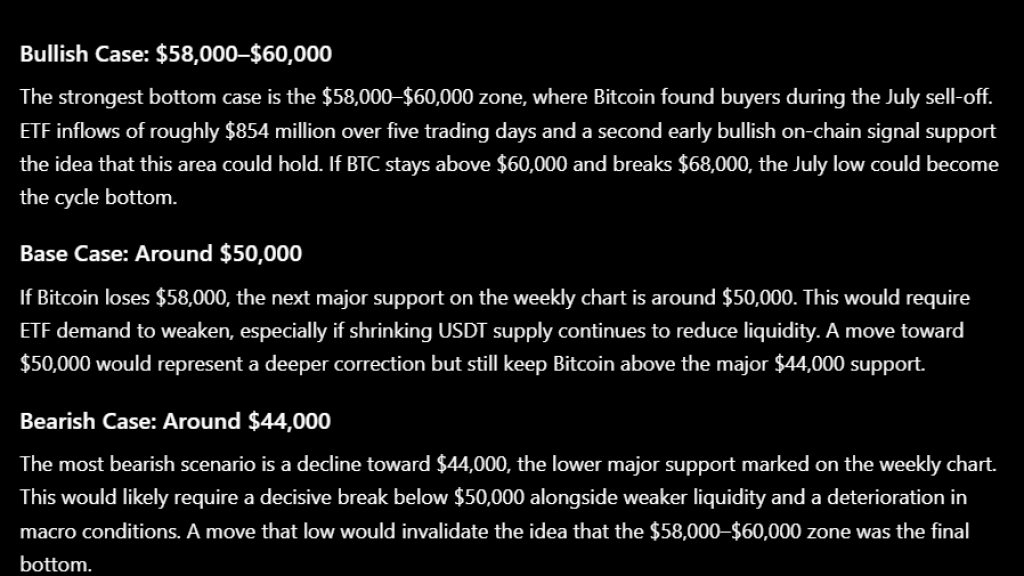
The most likely Bitcoin bottom is around $50,000.
That does not mean the BTC price must fall there. The bullish case remains $58,000–$60,000, especially if the $60,000 support continues to hold and ETF demand remains strong. The latest five-day ETF inflow of $853.5 million gives buyers a meaningful source of demand.
 Source: ChatGPT
If Bitcoin loses $58,000, then $50,000 starts coming into view. Think about it. From that October 2025 high of $125,245.57, a drop to $50,000 would be a 60% fall. That is a big haircut.
There is an even uglier picture too. If things really go south, the Bitcoin price could go down to $44,000. That is about a 65% drop from the top.
For that to happen, a few things would have to line up. ETF money would need to dry up. Liquidity would have to get worse. And the broader economy would have to turn risk-off in a serious way.
Breaking Down the Reasoning: Halving Cycles, Liquidity and On-Chain Signals
Historical Bitcoin cycles provide the first reference point. The 2018 bear market produced an 83.6% drawdown, taking BTC to about $3,217. The 2022 cycle produced a 76.7% drawdown, ending near $15,742.
The important detail is that drawdowns have become smaller. Galaxy’s 2026 cycle research puts the historical peak-to-trough declines at 85%, 84% and 77%, and estimates that the current cycle had reached about a 51% drawdown by June.
That makes a $50,000 floor more reasonable than simply applying an old 80%-plus crash to the 2025 peak. Bitcoin also has a new source of demand through U.S. spot ETFs, which did not exist during the 2018 or 2022 bottoms.
Liquidity is the main concern. The prompt included a roughly $4 billion contraction in USDT supply over 60 days, which would reduce some of the capital available for crypto trading if the contraction represents money leaving the ecosystem.
Also, ETF demand is moving in the opposite direction, creating a genuine tug-of-war between institutional buying and broader liquidity conditions.
Related Bitcoin news: AI Models Are Split on Bitcoin’s Next Move – Here Are the Details
Does This Number Hold Up Against 2018 and 2022?
A $50,000 bottom would be much shallower than both major historical bear-market lows. The BTC price would need to fall about 60% from $125,245, compared with the roughly 84% and 77% declines seen in 2018 and 2022.
That difference matters because Bitcoin’s market structure has changed. Spot ETFs now give institutions direct exposure through regulated products, and the market has deeper derivatives and custody infrastructure than it had in 2018. Galaxy’s latest cycle study also finds that Bitcoin’s historical drawdowns have become progressively smaller.
So the historical data does not rule out $50,000. It actually provides a case for a shallower decline this cycle.
The Case This Number Is Wrong
The real danger to that $50,000 idea is a liquidity shock. Think about what happens if ETF money stops coming in after five straight days of positive flows. Stablecoin supply keeps shrinking. The broader economy turns sour. Then the Bitcoin price does not stop at $50,000. It keeps falling to that $44,000 weekly support level.
There is another problem too. Timing. Galaxy did some work on past cycles. They found that bottoms usually do not show up until 12 to 13 months after the peak. We might not be there yet.
So here is how it breaks down. $58,000 to $60,000 is the bull’s last stand. $50,000 is the baseline guess for a bottom. $44,000 is the scary one if things get bad.
For now, all eyes are on $60,000. That is the first line the bulls have to hold. If it breaks, that $50,000 prediction stops sounding crazy.
Frequently Asked Questions
What is ChatGPT’s Bitcoin bottom prediction
ChatGPT’s base-case estimate puts Bitcoin’s potential bottom around $50,000, with $58,000–$60,000 as the bullish floor and $44,000 as the deeper bearish scenario.
Could Bitcoin fall to $50,000Yes. A break below the $58,000–$60,000 support zone could open the path toward $50,000, especially if Bitcoin ETF inflows weaken and crypto liquidity continues to contract.
Is $60,000 a key Bitcoin support levelYes. Bitcoin has found buyers around $60,000 after the July decline toward $58,000. Holding this area could support a recovery, but losing it would increase the probability of a move toward $50,000.
Subscribe to our YouTube channel for daily crypto updates, market insights, and expert analysis.
The post ChatGPT Predicts Where Bitcoin’s Bottom Is – You Won’t Believe the Number appeared first on CaptainAltcoin.