This Sui price prediction arrives at a moment when the chart itself is doing most of the talking, a multi-year descending trendline is sitting right at the edge of a breakout, and a community
This Sui price prediction arrives at a moment when the chart itself is doing most of the talking, a multi-year descending trendline is sitting right at the edge of a breakout, and a community is already dreaming several multiples ahead.
Add in some fresh on-chain activity data, and the ingredients are all there for a story worth digging into, so here is the complete breakdown of where SUI could be headed from here.
SUI Price Today: Live Data and 24-Hour Change
SUI is trading around 0.7093 dollars at the time of writing, up about 1.07% on the current weekly candle after opening near 0.7017, reaching a high of 0.7480, and dipping to a low of 0.6926 on the SUI/USDT weekly chart on Binance.
CoinGlass data shows SUI slightly lower at 0.7087 dollars, down 1.83% over the past 24 hours, a short-term dip that is still playing out inside a larger weekly structure that looks far more constructive.
The broader footprint behind this Sui price forecast remains substantial. Market capitalization sits near 2.90 billion dollars, with open interest around 613.54 million dollars, showing heavy leveraged positioning around current levels.
Futures volume over the past 24 hours came in near 686.88 million dollars, alongside spot volume of about 131.76 million dollars, a split that points to derivatives traders driving a large share of near-term activity.
Circulating supply stands at 4.09 billion SUI out of a 10.00 billion total and max supply, meaning less than half of Sui's eventual supply is currently in circulation.
Source: CoinGlass, Sui data snapshot, September 15, 2026.
The Sui news cycle right now includes a post from the Sui Community account, tagging Grok and asking whether SUI could surge as much as 1,500% in the next bull run, pointing to a chart that highlights a prior 900% move and a larger 1,500% move, both launching from the same area the community is calling strong support. 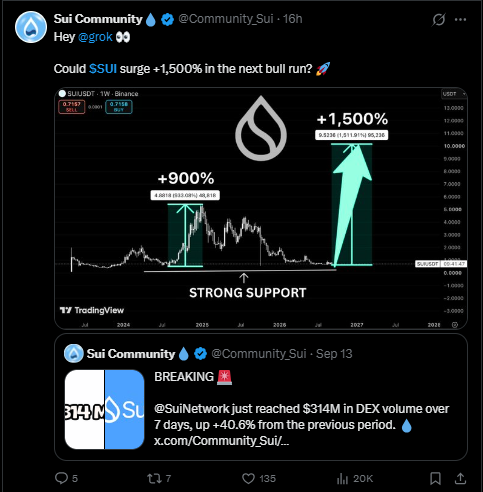
This follows an earlier update from the same account on September 13, which flagged that Sui Network had just reached 314 million dollars in DEX volume over a 7-day period, up 40.6% from the previous stretch.
This kind of Sui latest news feeds into the broader Sui trend analysis picture, since rising DEX volume alongside a chart-based bull case tends to energize a community heading into a potential breakout, even though the specific percentage targets being floated are informal and speculative rather than a forecast from an official source.
Whether SUI actually delivers anything close to those historical multiples again remains to be seen, but growing on-chain volume is a more concrete data point worth tracking alongside the technical setup.
Source: Sui Community (@Community_Sui) on X, September 14 and September 13, 2026.
Quick Take
CMP: 0.7093 Weekly trigger level: break and close above 0.9495 Weekly failure level: break and close below 0.6349 Data as of September 15, 2026, around 14:57 UTC+5:30 Risk note: this is a weekly timeframe setup, so confirmation takes full weekly closes rather than intraday moves, and the targets above the trigger are wide, multi-year zones rather than precise numbers.
SUI Technical Forecast: A Descending Trendline Nearing Its Test
Looking at the SUI/USDT pair on the weekly Binance chart, the setup here has been building for a long stretch of time. 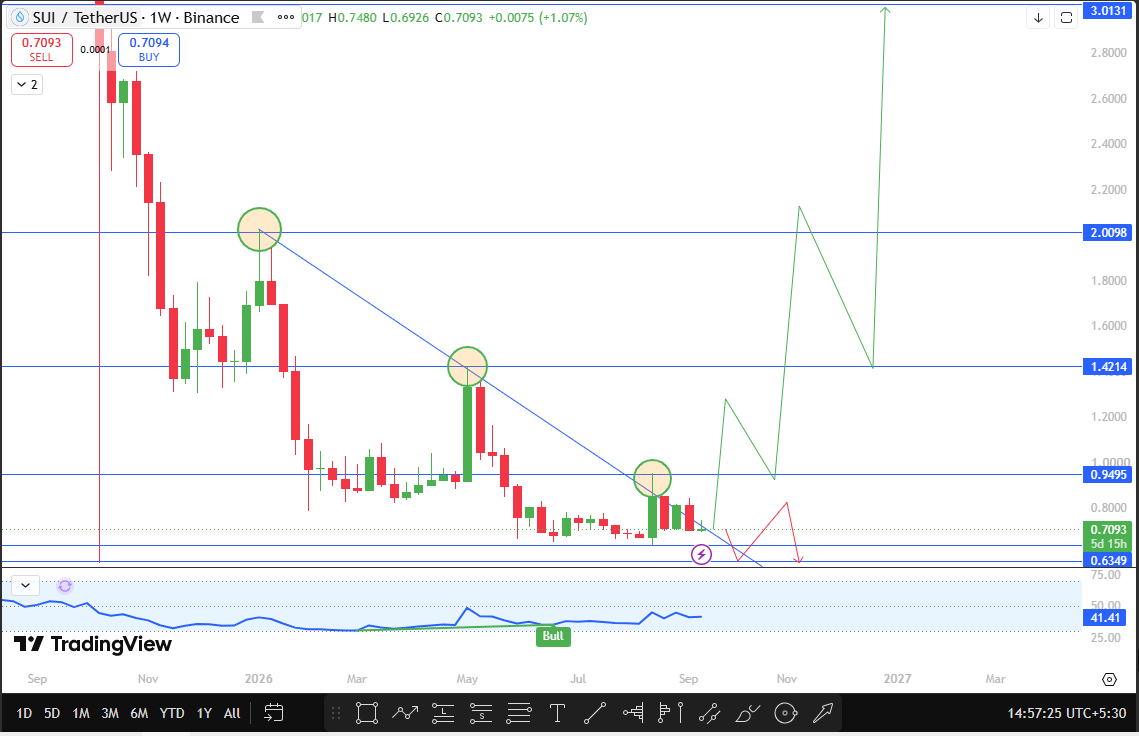
Price has been tracing out a descending trendline connecting a series of lower highs going back roughly a year, and after grinding along the bottom of its recent range, SUI is now pushing back up toward that same trendline for what would be a meaningful test.
A trendline built from multiple touchpoints over this kind of timeframe carries real technical weight, since it reflects a long, sustained battle between buyers and sellers rather than a short-term pattern that could easily be noise.
The weekly oscillator is currently reading 41.41, still below the midpoint, though it has already flashed a bullish tag earlier in this recovery leg, hinting that momentum has been slowly turning even before the trendline test itself has resolved.
The next major decision point on this Sui price prediction sits at 0.9495. If SUI manages a break and close above that level on a weekly basis, it would confirm a genuine descending trendline breakout, and this SUI price prediction favors an extended move toward 1.4214 as the first major resistance zone.
From there, 2.0098 stands out as the next resistance, with the community's more ambitious 3.0131 target sitting as the far upside zone. This SUI technical analysis would only start taking seriously after the earlier levels are cleared in sequence.
On the downside, if SUI fails to hold this area and breaks and closes below 0.6349, this setup would be considered invalidated, suggesting the descending trendline is still very much intact and sellers remain in control of the broader structure.
Sui Price Prediction: Support and Resistance Levels
Level Type
Price
Distance From CMP
Major Resistance (Community Target)
3.0131
+324.9%
Resistance 2
2.0098
+183.4%
Resistance 1
1.4214
+100.4%
Breakout Trigger
0.9495
+33.9%
Current Price
0.7093
—
Invalidation Level
0.6349
-10.5%
Bull, Base, and Bear Scenarios for Sui
In the bullish case, SUI holds this area and delivers a weekly close above 0.9495, confirming the descending trendline breakout this Sui price outlook has been building toward.
If that plays out alongside continued strength in on-chain DEX volume, the path toward 1.4214 opens up first, with 2.0098 and the community's 3.0131 target becoming realistic conversations only much further down the line.
The base case has SUI consolidating between 0.6349 and 0.9495 while the market waits for a decisive weekly close in either direction, treating the current test of the descending trendline as unresolved rather than confirmed.
The bearish case plays out if 0.6349 gives way on a weekly closing basis, which would invalidate this setup entirely and point to sellers reasserting control of the longer-term downtrend that has defined SUI for most of the past year.
Risks to This SUI Price Outlook
This is a weekly timeframe forecast, which means it plays out over weeks and months rather than days, and near-term volatility can look very different from the broader trend being described here.
The 900% and 1,500% figures circulating in the community are based on informal chart commentary rather than any official analysis, so they should be treated as speculative upside scenarios rather than realistic near-term targets.
Broader crypto market conditions, including Bitcoin's own trend and overall risk appetite, can easily override an individual altcoin setup like this one regardless of how clean the trendline pattern looks.
Key Terms Glossary
Descending trendline: A downward-sloping line connecting a series of lower highs, often acting as resistance until it is decisively broken. Weekly close: The final price at the end of a trading week, used to confirm whether a breakout or breakdown is genuine rather than a temporary wick. Open interest: The total number of outstanding derivative contracts that remain open and unsettled at a given time. DEX volume: The total value of trades executed through decentralized exchanges over a given period, often used as a gauge of on-chain activity. Invalidation level: A price point where, if broken, a specific technical setup or pattern is considered to have failed.
Disclaimer
This article is for informational purposes only and should not be considered financial advice. The Sui price prediction figures, SUI price target levels, and all technical analysis shared here are based on chart patterns and publicly available data at the time of writing. Cryptocurrency markets are highly volatile, and prices can move sharply in either direction without warning. Always do your own research and consult a qualified financial advisor before making any investment decisions involving SUI or any other digital asset.