This crude oil price prediction looks at whether $WTI can extend its climb toward resistance or slip back through recent support. The setup comes as a separate but closely watched signal from
This crude oil price prediction looks at whether $WTI can extend its climb toward resistance or slip back through recent support.
The setup comes as a separate but closely watched signal from the refined products market.
The heating oil crack spread has surged to levels not seen since 2009, adding a fresh layer of context to the technical picture.
WTI (West Texas Intermediate) is one of the primary global benchmarks for $WTI pricing, traded on NYMEX and used as a reference point for contracts across the energy market.
Its price movements are shaped by a mix of supply dynamics, refining capacity, and broader demand trends, all of which feed into the current channel structure on the daily chart.
WTI Crude Oil Futures trade at $100.66, down 0.1% over the past 24 hours, with the 24-hour range holding between $99.25 and $102.24.
On the daily spot chart, the price closed at $100.090, down 1.21% for the session. This WTI price prediction reflects data current as of September 18, 2026.
Live Market Data
Metric
Value
Price (Futures)
$100.66
24h Change
-0.1%
24h Range
$99.25 - $102.24
Daily Close (Spot)
$100.090
Daily Change
-1.21%
Exchange
NYMEX
Source: market data taken from CoinGecko, as of Sep 18, 2026. Figures may vary slightly across other tracking websites.
Crude Oil News Today
A notable signal from the refined products market has drawn attention alongside this crude oil price prediction. 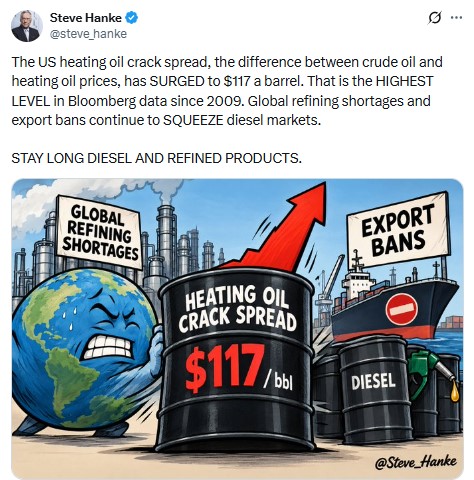
Source: Data Taken From @Steve_hanke, X Account, as of Sep 18, 2026
Economist Steve Hanke highlighted that the US heating oil crack spread, the price difference between WTI and heating oil, has surged to $117 per barrel, the highest level in Bloomberg data since 2009.
He attributed the move to global refining shortages and export bans continuing to squeeze diesel markets, a dynamic that could support demand even if broader price action remains range-bound in the near term.
Technical Analysis for WTI (Crude Oil)
The daily chart shows WTI trading inside a well-defined ascending channel, with price recently pulling back from the channel's upper region toward its midline. 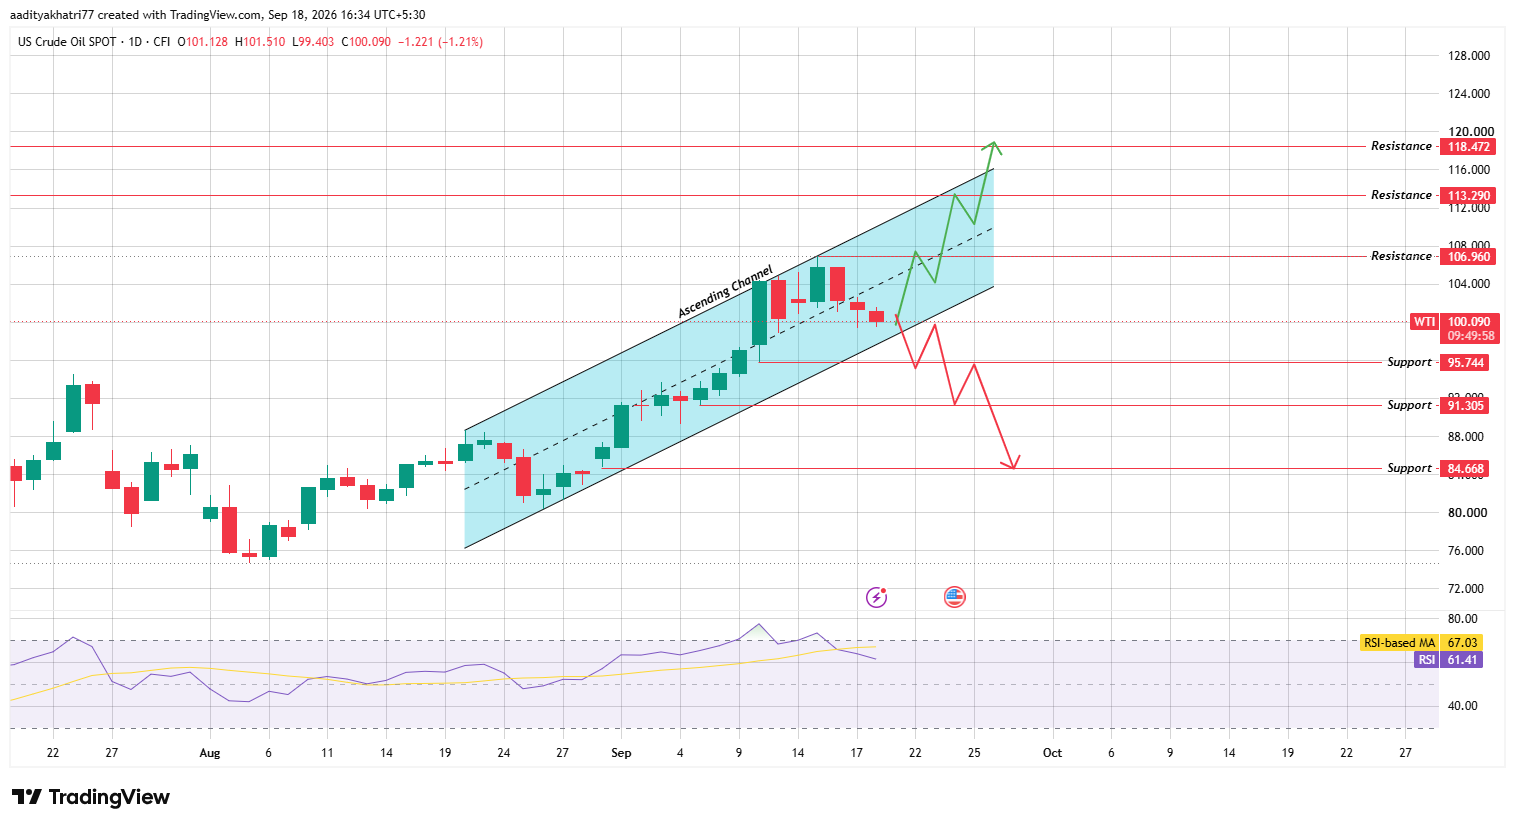
Source: Chart taken from TradingView, as of Sep 18, 2026
RSI sits at 61.41, below its moving average of 67.03, suggesting momentum has eased slightly even as the broader uptrend structure remains intact.
Can $WTI Break Toward Higher Resistance?
If volume increases and price pushes back toward the top of the channel, clearing $106.960 would open the path toward $113.290.
A sustained move beyond that level could extend toward $118.472, a scenario that would align with the bullish signal coming from the surging crack spread in refined products markets.
What Happens If $WTI Breaks the Lower Boundary?
If the price continues lower and breaks below the channel's lower boundary near $95.744, the setup turns bearish.
A deeper decline could test $91.305, and a more extended pullback may expose $84.668 if selling pressure persists.
Support and Resistance Levels
Support
Resistance
$95.744
$106.960
$91.305
$113.290
$84.668
$118.472
Bull, Base, and Bear Scenarios
Scenario
Setup
Level
Bull
Channel breakout with volume
$106.960 → $118.472
Base
Continued range inside channel
$95.74 - $106.96
Bear
Lower boundary break, channel breakdown
$95.744 → $84.668
Methodology
This crude oil price prediction is based on daily chart analysis using ascending channel mapping, support and resistance identification, and RSI momentum readings, cross-checked against live market data as of September 18, 2026.
Expert Opinion
Analysts tracking $WTI's channel structure note that a pullback toward the midline after an extended rally is a normal part of trend continuation, provided the lower boundary holds.
The unusually wide crack spread adds a fundamental tailwind that could reinforce any technical breakout attempt in the coming sessions.
Disclaimer: This $WTI price prediction is based on technical chart analysis and current market data and should not be treated as financial advice. Commodity markets are highly volatile, and readers should conduct their own research and consider their risk tolerance before making any investment decisions.