Crude oil price prediction searches are rising, and traders are watching the screen a little closer than usual. Which way it goes from here changes everything, and the levels that matter are
Crude oil price prediction searches are rising, and traders are watching the screen a little closer than usual. Which way it goes from here changes everything, and the levels that matter are marked below.
The editorial desk holds no personal position in this market. This is purely a chart and data read.
Quick answer: For the crude oil price prediction, WTI trades at $90.67. Holding above $88.79 targets $106.76, then $119.65 and $130.36, while a daily close below $79.66 invalidates the forecast.
Crude Oil Price Today: Live Market Data and Key Trendline Snapshot
The crude oil price today, or current market price (CMP), is $90.67, with the latest daily candle down 0.64%. Price sits 2.07% above $88.79, where the ascending trendline passes close by.
Source: TradingView (TVC), Oct 5, 2026, 4:00 PM.
Crude Oil News Today: Saudi Pipeline Report and Price Impact
An unverified post from Zerohedge on X says Brent pared its loss after a report of an attack on the Saudi east-west pipeline. 
Anyone following crude oil news today will recognize the headline, but the post gives no further detail, so no supply impact can be confirmed. Treat it as a volatility risk, not a verified event.
Source: Zerohedge on X, about 12m before Oct 5, 2026, 4:00 PM.
Key Takeaways: WTI Price Target and Breakout Levels at a Glance
CMP is $90.67 on the daily TVC chart.
Price is retesting an ascending trendline for the third time.
Holding above $88.79 targets $106.76, then $119.65 and $130.36.
A daily close below $79.66 invalidates the forecast.
Crude Oil Technical Analysis: Third Trendline Retest, Daily Chart
Methodology: WTI CFD, daily timeframe, TVC, with RSI divergence as the indicator. The forecast is invalid on a daily close below $79.66.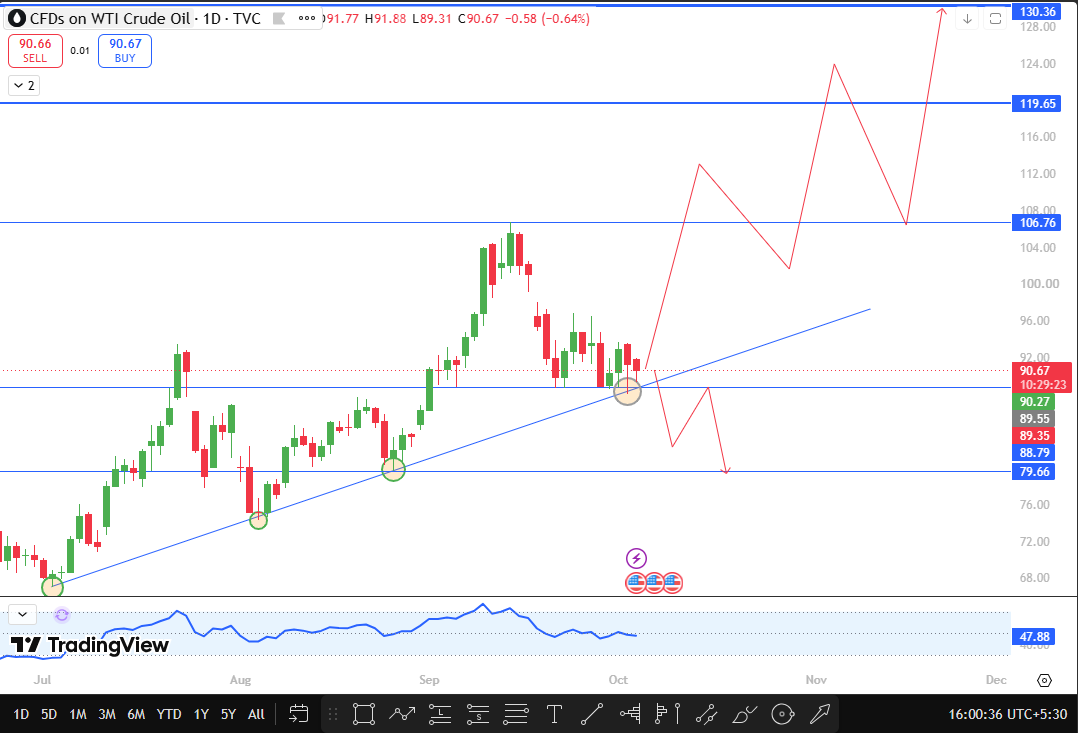
Price has climbed along an ascending trendline since early July. It touched the line in early August and again in late August, and each touch led to a fresh push higher.
The current dip is the third retest, and the latest candles are showing rejection from the line.
RSI divergence reads 47.88, a neutral reading just under the midline, with no bullish or bearish label on the panel.
While the price holds above $88.79, the wider crude oil trend analysis stays constructive, and this crude oil technical analysis keeps the upside levels in play. Rejection is not confirmation, so a hold above $88.79 on daily closes still matters.
Crude Oil Price Forecast: Support and Resistance Levels Ahead
Level
Type
Importance
Distance From CMP
$130.36
Resistance
Third upside target
+43.77%
$119.65
Resistance
Second upside target
+31.96%
$106.76
Resistance
First major target
+17.75%
$90.67
CMP
Current price
0%
$88.79
Support
Trendline hold level
-2.07%
$79.66
Support
Forecast invalidation
-12.14%
WTI Forecast: Bullish, Base, and Bearish Price Scenarios Explained
Bullish Scenario: Holding Above $88.79 Opens $106.76 and $119.65
Confirmation needs price to sustain above $88.79 on daily closes while the third retest holds the trendline. The first WTI price target is $106.76 as major resistance, followed by $119.65 and then $130.36. A daily close back under $88.79 would weaken the case.
Base Scenario: Price Chops Between $79.66 and $88.79 Near the Trendline
If the price slips under $88.79 but holds above $79.66, the forecast stays valid, though the upside is delayed. Price may chop near the trendline while buyers rebuild.
Bearish Scenario: Daily Close Below $79.66 Invalidates the Forecast
A daily close below $79.66 cancels the bullish read. The chart carries no downside target, since the forecast simply stops working there. That level sits 12.14% under CMP, so price has room to wobble before the idea fails.
The move gains weight if the trendline breaks cleanly first and loses weight if buyers reclaim $88.79 quickly.
WTI Market Outlook: Trendline Retest, Volatility, and Event Risk
A third touch of the same trendline can go either way. Buyers often defend a line that has held twice, but every retest also tests its strength.
The chart shows three upcoming US event markers; their details were not supplied, so treat them as volatility risks, alongside the pipeline headline.
Risks to the WTI Price Prediction and Forecast Invalidation Rules
The $88.79 level sits only 2.07% below CMP, so a small dip is enough to test the case. The upside levels are far away, at +17.75%, +31.96%, and +43.77%.
The pipeline report is unverified and carries no detail. A daily close below $79.66 ends the forecast.
WTI Technical Analysis: Final Conclusion and the Next Price Move
Price is retesting its ascending trendline for the third time from $90.67. Everything now hinges on $88.79 holding and $79.66 staying intact.
Holding above $88.79 puts $106.76, $119.65, and $130.36 in play, while a daily close below $79.66 ends the forecast.
Disclaimer: Educational Chart Analysis, Not Financial Advice
Educational content only, not financial advice. Markets are volatile, so do your own research before trading.