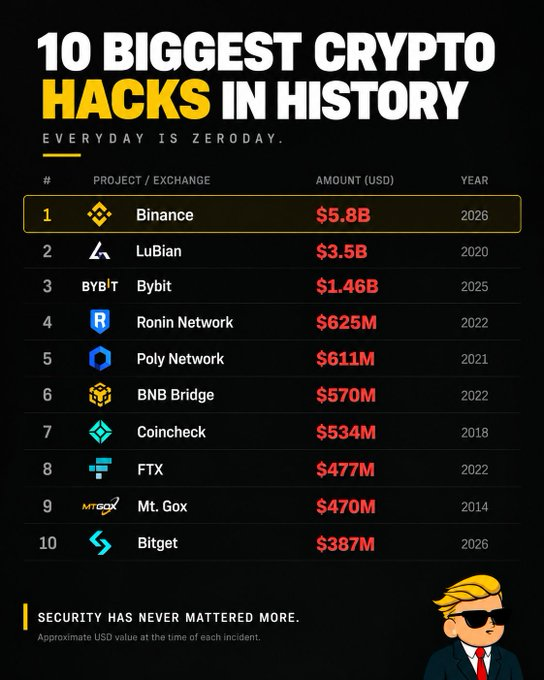
Binance tops the ranking with a reported $5.8 billion incident, exceeding LuBian's listed $3.5 billion loss by $2.3 billion. The list spans twelve years, covering exchange breaches, bridge ex
- Binance tops the ranking with a reported $5.8 billion incident, exceeding LuBian's listed $3.5 billion loss by $2.3 billion.
- The list spans twelve years, covering exchange breaches, bridge exploits and network incidents across several parts of crypto.
- The figures remain approximate claims from the graphic, with no sources or recovery details supplied to verify the totals.
Crypto hack losses feature prominently in a new ranking of ten major incidents. The figures span twelve years, with reported damages ranging from $387 million to $5.8 billion.
Binance and LuBian Lead the Reported Losses
A WallStreetBets post lists Binance, LuBian and Bybit among the largest incidents. The graphic assigns Binance a reported $5.8 billion loss in 2026. LuBian follows with $3.5 billion, attributed to an incident in 2020.
Source:
X
The difference between these figures reaches approximately $2.3 billion. Binance's listed amount also stands nearly four times above Bybit's $1.46 billion. Bybit occupies third place, with the graphic dating its incident to 2025.
These three entries sit well above the remaining incidents. The fourth-ranked Ronin Network appears with $625 million from 2022. Poly Network follows closely, with $611 million attributed to 2021.
BNB Bridge takes sixth place with a reported $570 million loss. Coincheck follows at $534 million, linked to its 2018 incident. Both entries exceed the half-billion-dollar mark in the graphic.
The remaining entries include FTX, Mt. Gox and Bitget. FTX appears eighth, with $477 million attributed to 2022. Mt. Gox follows at $470 million, dating back to 2014.
Bitget completes the ranking with a reported $387 million incident in 2026. Its position places it below every other listed event. The graphic doesn't however describe how these incidents were chosen.
This list covers blockchains, bridges, and centralized exchanges. Network-related incidents include Ronin Network and Poly Network. BNB Bridge also shows cross-chain infrastructure features in the ranking.

These categories involve different systems and potential security weaknesses. Exchange incidents may involve platforms holding customer assets. Bridge exploits can involve mechanisms transferring assets between blockchain networks. Their dollar values alone cannot explain how each event occurred.
The ranking also places FTX alongside reported hacks and technical exploits. A financial collapse and a security breach are not necessarily the same event. The graphic offers no breakdown explaining the classification of its FTX figure.
The dates show that major incidents have continued across crypto's development. Mt. Gox represents the earliest entry, dating back to 2014. Coincheck was followed by LuBian in 2018 and then 2020.
In 2021 and 2022, the incidents of Poly Network and the Ronin Network were followed. BNB Bridge and FTX also appear under 2022. Bybit, Binance and Bitget bring the ranking into 2025 and 2026.
This timeline shows that reported security losses did not end with crypto's early exchange failures. Newer entries remain present alongside incidents from previous market cycles. The graphic thus covers several generations of crypto platforms.
But its figures need further elaboration before direct comparisons can be drawn. The amounts shown in the graphic are approximate values at the time of each incident. Does not offer sources, valuation methods, or recovery adjustments.
Those missing details are important when using the dollar totals of the ranking. Recovered assets could affect the final losses associated with an incident. Different valuation dates could also produce different reported amounts.
The ranking is presented as a security warning in the last line: "Everyday is zeroday. A zero-day vulnerability is a computer software weakness that is not patched. However, the graphic does not prove that all of the incidents listed included one. Its figures document the ranking's claims, not the specific causes behind each loss.