Positive US Nonfarm Payrolls news lifted Bitcoin price to nearly $65,352 yesterday, but today’s session presents a more complicated picture. Bitcoin, XRP, and Chainlink now trade close to lev
Positive US Nonfarm Payrolls news lifted Bitcoin price to nearly $65,352 yesterday, but today’s session presents a more complicated picture. Bitcoin, XRP, and Chainlink now trade close to levels that could determine their next intraday moves.
Bitcoin indicators favor buyers, whereas XRP indicators remain bearish despite a recent breakout attempt. Chainlink presents a mixed picture after several days of consolidation. Here is what the charts reveal about each crypto price prediction for today.
Bitcoin Price Indicators Favor Another Attempt Above $65,082
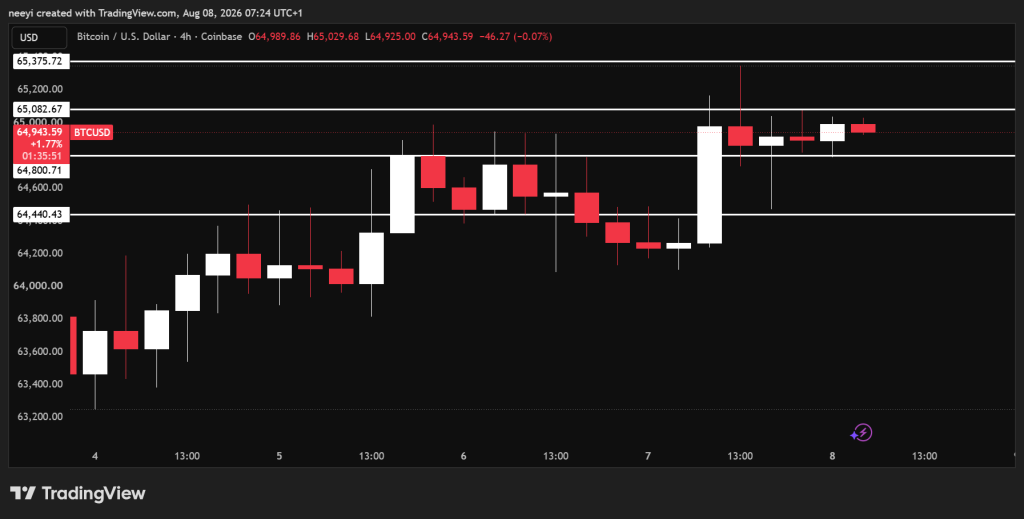
Bitcoin price has consolidated since reaching approximately $65,352 after the positive NFP news. A look at the Bitcoin chart shows BTC currently moving between $64,800 and $65,082.
That narrow range provides the clearest guide for today. A confirmed break above $65,082 could open the path toward $65,375. Failure to defend $64,800 could send BTC toward $64,400.
BTC Price Chart / TradingView.com
The RSI reading of 60.253 gives Bitcoin a buy rating. This value places BTC above the neutral 50 mark without placing it inside overbought territory. Buyers therefore have some control, although resistance could still limit the advance.
The MACD reading of 281.6 also produces a buy rating. Positive MACD territory shows that recent upward price movement remains stronger than the previous downward pressure.
The Ultimate Oscillator stands at 56.001 and supports the bullish case. Its position above 50 shows that buying pressure remains present across several timeframes.
Bull Bear Power records 710.5005, which provides the strongest positive reading in the group. Bulls currently have a clear advantage based on this indicator.
Bitcoin IndicatorValueActionRSI(14)60.253BuyMACD(12,26)281.6BuyUltimate Oscillator56.001BuyBull Bear Power(13)710.5005Buy
Bitcoin Price Prediction for Today
- Bullish scenario: Bitcoin price could reach $65,375 after a confirmed break above $65,082.
- Neutral scenario: BTC could remain between $64,800 and $65,082 if neither side secures control.
- Bearish scenario: A break below $64,800 could expose the lower support around $64,400.
XRP Price Retest Could Decide Whether the Breakout Survives
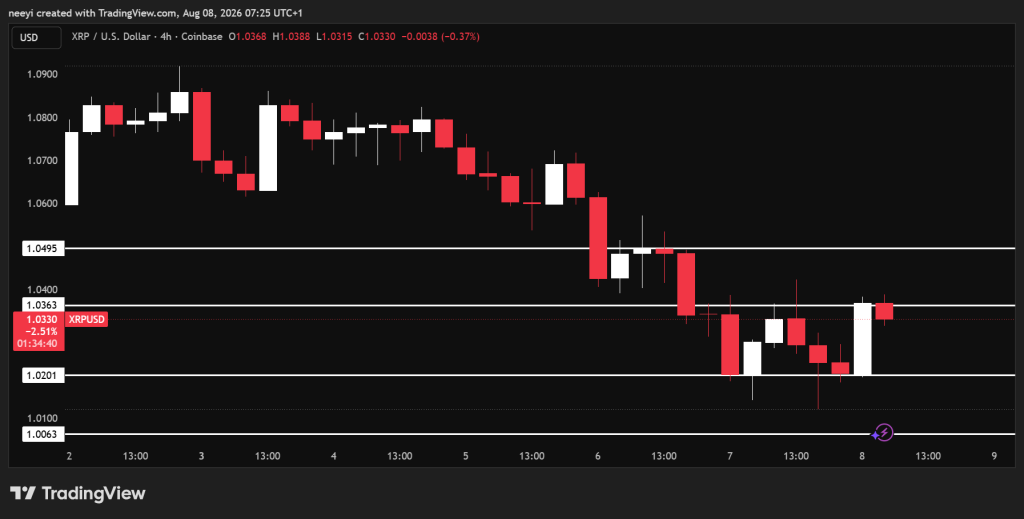
XRP price has mainly traded between $1.02 and $1.03. The latest 4 hour candle moved above $1.03, and XRP is now retesting that former resistance as possible support.
A successful bounce from $1.03 could carry XRP toward $1.049 or $1.05. Renewed weakness below $1.02 could send the price toward $1.00. That psychological level has held firmly during the recent turbulence and may remain intact unless major negative news appears.
XRP Price Chart / TradingView.com
The indicators remain less encouraging. XRP’s RSI stands at 40.514, which shows weak demand and gives a sell rating. The reading remains above oversold territory, so further weakness is still possible.
The MACD value of negative 0.012 confirms that bearish pressure has not disappeared. The Ultimate Oscillator reading of 48.019 also remains below the neutral 50 level.
Bull Bear Power records negative 0.0075 and gives another sell rating. XRP therefore needs price action above $1.03 to challenge the bearish indicator readings.
XRP IndicatorValueActionRSI(14)40.514SellMACD(12,26)Negative 0.012SellUltimate Oscillator48.019SellBull Bear Power(13)Negative 0.0075Sell
XRP Price Prediction for Today
- Bullish scenario: XRP price could test $1.049 or $1.05 if the retest above $1.03 succeeds.
- Neutral scenario: XRP could remain confined between $1.02 and $1.03 throughout today.
- Bearish scenario: Losing $1.02 could send XRP toward the major $1.00 support level.
Chainlink Price Indicators Remain Divided Inside a Narrow Range
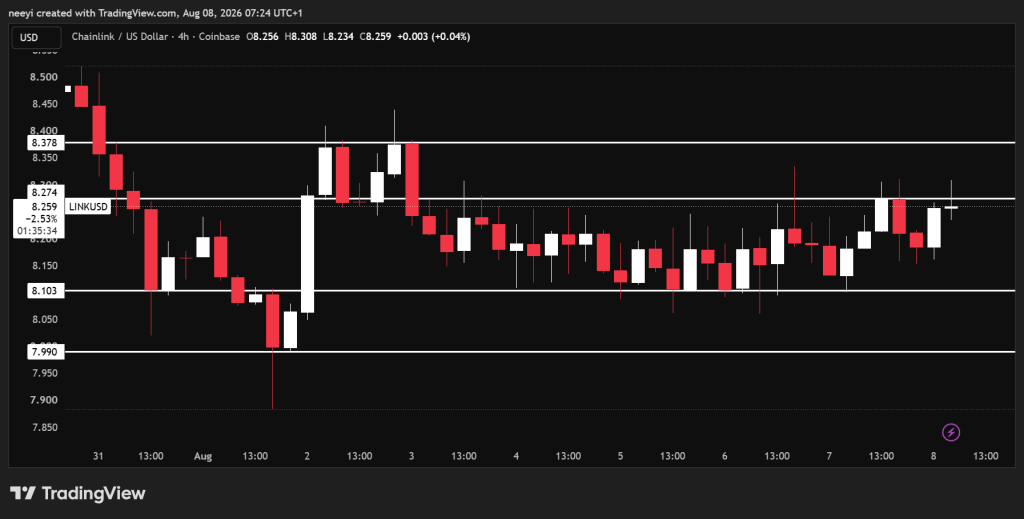
Chainlink price has consolidated since August 3, mainly between $8.10 and $8.27. A break above $8.27 could take LINK toward $8.37, whereas a drop below $8.10 could expose $7.99.
Chainlink Price Chart / TradingView.com
LINK’s RSI reading of 53.913 remains neutral, although its position above 50 gives buyers a small advantage. The MACD remains negative at 0.006 and produces a sell rating.
The Ultimate Oscillator stands at 49.9, almost exactly at its neutral midpoint. Bull Bear Power records 0.077 and provides a buy rating. These divided readings fit the consolidation visible on the Chainlink chart.
Chainlink IndicatorValueActionRSI(14)53.913NeutralMACD(12,26)Negative 0.006SellUltimate Oscillator49.9NeutralBull Bear Power(13)0.077Buy
Chainlink Price Prediction for Today
- Bullish scenario: Chainlink price could reach $8.37 after breaking above $8.27.
- Neutral scenario: LINK could continue moving between $8.10 and $8.27.
- Bearish scenario: Losing $8.10 could take Chainlink price toward $7.99.
FAQs
How much will 1 Bitcoin be in 2030?According to leading institutional analysts and crypto experts, Bitcoin (BTC) is projected to trade anywhere from $150,000 to over $1,500,000 by 2030, with most base-case targets settling around $500,000 to $700,000 per coin.
Do banks use Chainlink?Chainlink <> Swift: Chainlink has been a key technology partner in successful pilot programs with Swift, the global financial messaging network used by over 11,500 banks. These pilots demonstrated how tokenized assets could be transferred across different blockchains using existing Swift infrastructure.
Will XRP reach $1000 dollars?XRP hitting $1,000 is mathematically and economically unlikely because it requires an impossible market capitalization, though online speculation remains high.
Subscribe to our YouTube channel for daily crypto updates, market insights, and expert analysis.
The post Crypto Price Prediction for Today, August 8: Bitcoin (BTC), XRP, and Chainlink (LINK) appeared first on CaptainAltcoin.