Bitcoin has spent the past week moving sideways after one of its sharpest selloffs of 2026. Buyers have stepped in several times, although every recovery attempt has faded before reaching a c
Bitcoin has spent the past week moving sideways after one of its sharpest selloffs of 2026. Buyers have stepped in several times, although every recovery attempt has faded before reaching a convincing breakout.
That leaves the crypto market at an important point today, with Bitcoin, XRP, and Zcash each sitting near technical levels that could decide their next move over the next few trading sessions.
Bitcoin Price Holds Key Support as Bulls Try to Regain Control
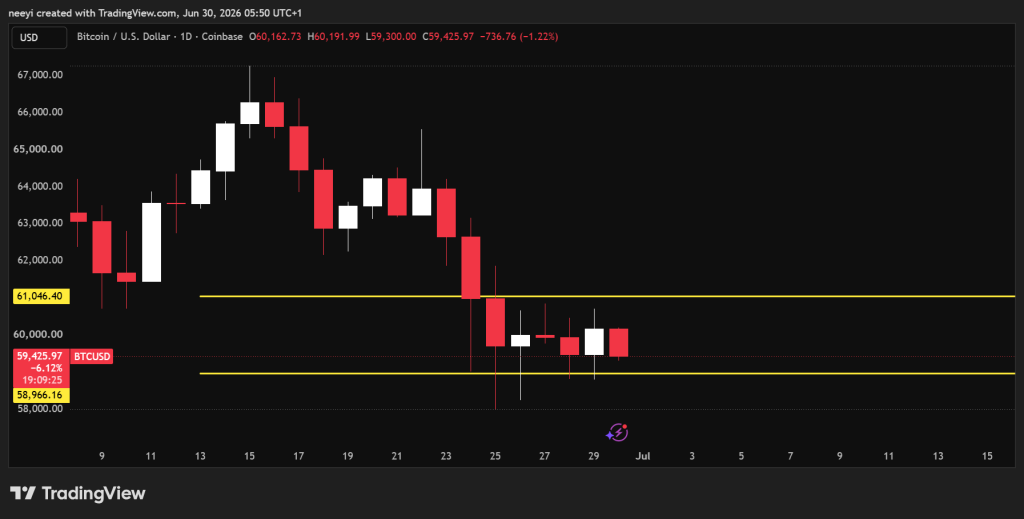
Bitcoin price has struggled to build any meaningful upside since June 24. During the past week, BTC has traded mostly between $59,000 and $61,000, with a brief drop into the $58,000 and $57,000 area before buyers pushed the price back higher.
Selling pressure intensified after a sharp crash erased tens of billions from the crypto market some days ago. That move dragged Bitcoin to a 21 month low of $58,115 before volatility eased and price action became much tighter.
Another factor has kept pressure on BTC price. June’s PCE inflation reading came in at 4.1%. That weakened expectations that the Federal Reserve could begin cutting interest rates anytime soon. Higher interest rates usually strengthen the US dollar and increase bond yields. Institutional investors often reduce exposure to assets such as Bitcoin during those periods because they do not generate yield.
Spot Bitcoin ETFs have also remained under pressure. More than $4 billion has left spot Bitcoin ETFs during June. Redemptions from major funds including BlackRock’s iShares Bitcoin Trust and Fidelity Wise Origin Bitcoin Fund have forced issuers to sell Bitcoin into the market. That has added another source of supply during an already weak period.
Capital has also continued moving toward AI and semiconductor stocks. Traditional equities have attracted more institutional money during recent weeks. Crypto has therefore struggled to attract enough fresh buying interest to produce a sustained breakout.
Bitcoin could continue trading inside this relatively narrow range today. Bulls need to reclaim $61,000 before stronger upside momentum can return. A break below $58,900 would strengthen the bearish case. That could send Bitcoin toward the $57,000 area before today’s trading session ends.
A look at today’s Bitcoin indicators paints a mixed picture. The Relative Strength Index stands at 43. That shows momentum remains below the midpoint without entering oversold territory. The Awesome Oscillator stays below zero at negative 128. Short term momentum therefore remains weak. Momentum sits at negative 247, although the indicator points to early signs that downside pressure may be easing. The MACD level remains below zero at negative 310. That often appears before recovery attempts begin if buying pressure improves. Bull Bear Power stands at negative 847. Sellers still maintain a slight advantage despite recent stabilization.
Name Of IndicatorMetricsInterpretation Of MetricsRelative Strength Index (14)43Momentum remains below the midpoint and shows buyers have not fully regained strength.Awesome Oscillator-128Short term price momentum remains weaker than the longer trend.Momentum (10)-247Downside pressure has slowed although stronger buying has not arrived.MACD Level (12, 26)-310Trend remains below zero although bearish momentum continues to soften.Bull Bear Power-847Sellers still hold a modest advantage over buyers.
Bitcoin Price Prediction for Today
Bullish Scenario: Bitcoin breaks above $61,000 and extends the recovery toward higher resistance levels.
Neutral Scenario: BTC continues trading between $58,900 and $61,000 as buyers and sellers remain evenly matched.
Bearish Scenario: Bitcoin loses $58,900 support and falls toward the $57,000 region before the end of today’s session.
XRP Price Continues Building a Recovery Pattern
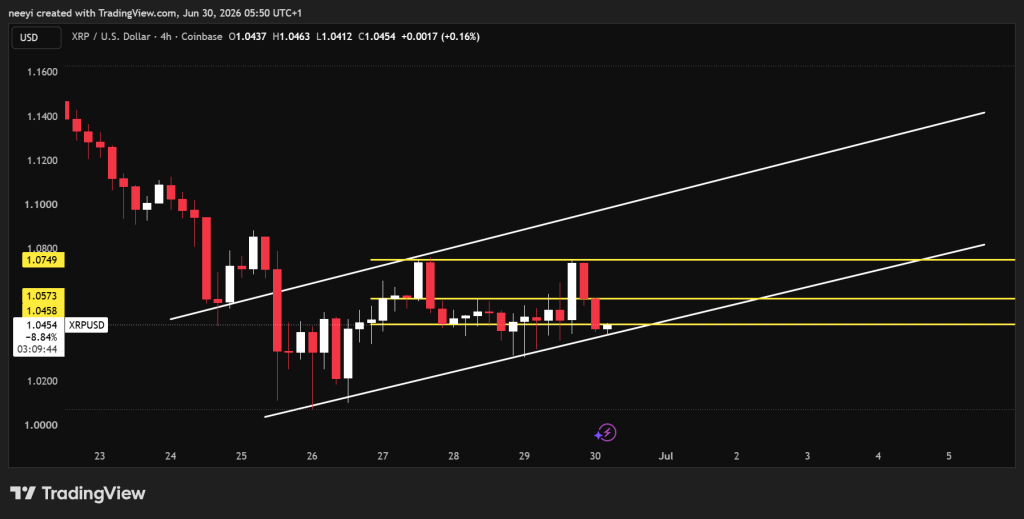
XRP price appears to be forming a medium term bullish structure despite recent weakness. A look at the 4 hour chart shows what resembles a rising channel. Price action inside that channel could determine whether Ripple finally establishes a stronger recovery.
XRP trades around $1.04 today. The first important level sits near $1.057. Buyers need to reclaim that area before attempting another move toward $1.07. Success above $1.07 would improve the technical picture and could open the door for a test of the upper boundary of the channel near $1.09.
Today’s indicators remain mixed. The Relative Strength Index stands at 45.02. Momentum therefore remains slightly below neutral. The Awesome Oscillator sits close to zero at 0.00304. That shows neither buyers nor sellers have taken firm control. Momentum reads negative 0.00490 and hints that selling pressure continues to ease.
The MACD level stays slightly below zero at negative 0.00477. Recovery attempts remain possible if buyers maintain support. Bull Bear Power reads negative 0.01530. Sellers still hold a narrow advantage.
Name Of IndicatorMetricsInterpretation Of MetricsRelative Strength Index (14)45.01661Momentum remains slightly below the midpoint.Awesome Oscillator0.00304Short term momentum remains balanced.Momentum (10)-0.00490Selling pressure has continued to weaken.MACD Level (12, 26)-0.00477Downtrend continues to lose strength gradually.Bull Bear Power-0.01530Sellers still maintain a slight edge over buyers.
XRP Price Prediction for Today
Bullish Scenario:XRP breaks above $1.057, pushes through $1.07, and climbs toward the top of the channel near $1.09.
Neutral Scenario: Ripple trades between $1.04 and $1.057 as buyers continue defending the developing channel.
Bearish Scenario: XRP loses channel support and slips below $1.04. That would increase the risk of another move lower before buyers attempt another recovery.
Zcash Price Pulls Back After Yesterday’s Strong Breakout
Zcash price delivered a strong breakout yesterday after moving above resistance near $396 and climbing to roughly $413. Price has since entered a healthy retracement during the past several 4 hour candles. Buyers now need to defend the former breakout area if they want the rally to continue.
Failure to hold $396 could send ZEC price toward the $390 to $385 area today.
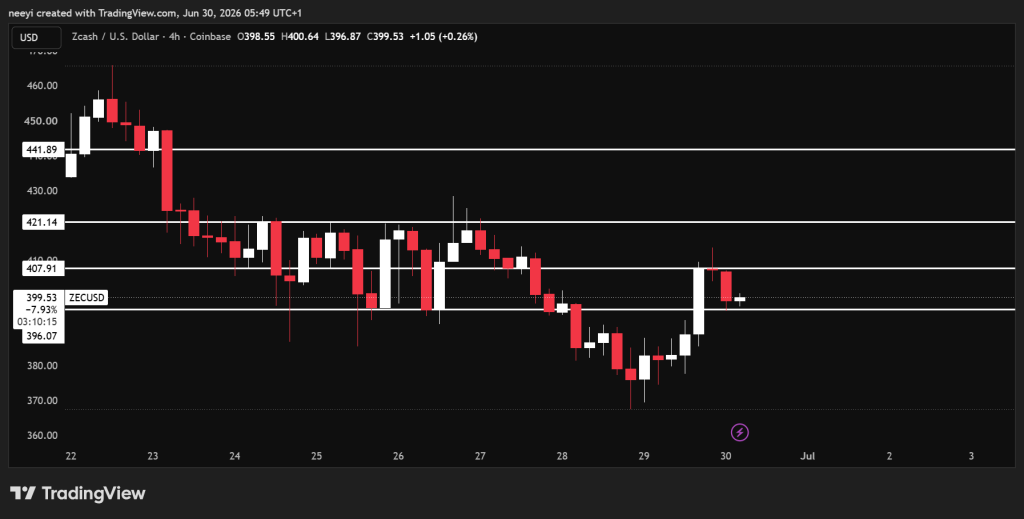
Support at $396 would keep the bullish structure intact. Price could then revisit resistance around $407. A successful move above that level would place $421 into focus. Another breakout above $421 could create room for a climb toward $441.
Indicator readings remain balanced despite the recent rally. The Average Directional Index stands at 30.36. That shows the current trend still has reasonable strength. The Awesome Oscillator remains slightly negative at negative 2.67 after the recent pullback. Momentum stands at 10.40 and shows recent price action remains stronger than earlier sessions. The MACD level reads negative 4.12. Trend confirmation has not fully caught up with the breakout. Bull Bear Power stands at 6.60. Buyers continue holding an advantage despite the retracement.
Name Of IndicatorMetricsInterpretation Of MetricsAverage Directional Index (14)30.36Current trend continues to show moderate strength.Awesome Oscillator-2.67Short term momentum has weakened after the breakout.Momentum (10)10.40Recent price action remains stronger than previous sessions.MACD Level (12, 26)-4.12Trend confirmation remains below zero despite the recent rally.Bull Bear Power6.60Buyers continue holding an advantage after the breakout.
Zcash Price Prediction for Today
Bullish Scenario: ZEC holds $396, breaks above $407, and continues toward $421. Strong buying above that level could open the way to $441.
Neutral Scenario: Zcash trades between $396 and $407 as the market digests yesterday’s breakout.
Bearish Scenario: ZEC loses support at $396 and declines toward the $390 to $385 region before buyers attempt another defense.
FAQs
How high will Zcash go?Zcash (ZEC) is currently trading around $388. While it hit an all-time high of $3,191 in 2016 during its initial launch hype, the consensus in the crypto community suggests a more realistic long-term target of $1,000 to $1,500, with some bullish models projecting a ceiling between $650 and $850 for the current market cycle.
Is Bitcoin BTC a good investment?Over the past decade, Bitcoin has returned roughly 40% to 60% a year on average, far outpacing the S&P 500 and gold over the same period, but with drawdowns those assets never see. Bitcoin has been written off many times.
Can XRP be as big as Bitcoin?It is highly unlikely XRP will ever reach the same size or price as Bitcoin. Bitcoin commands a roughly $1.5 trillion market cap with a capped supply of 21 million coins, whereas XRP has a significantly larger circulating supply and a market cap of around $83 billion
Subscribe to our YouTube channel for daily crypto updates, market insights, and expert analysis.
The post Crypto Price Prediction for Today, June 30: Bitcoin (BTC), XRP, and Zcash (ZEC) appeared first on CaptainAltcoin.