Crypto trading terminals are seeing a remarkable recovery in activity ever since early August. This week, on Wednesday, September 2, data from onchain analyst adam_tehc, showed that daily vol
Crypto trading terminals are seeing a remarkable recovery in activity ever since early August. This week, on Wednesday, September 2, data from onchain analyst adam_tehc, showed that daily volume across the sector crossed the $1 billion mark for the first time since the Official Trump token launch in January 2025. The $1.03B daily volume figure is noteworthy given that ,just two weeks ago, this was at around $338 million. What’s even more interesting is the market share of the terminals on the day, because almost none of the volume came from the front-ends that dominated the last retail cycle.
Gmgn and fomo Took Nearly Three Quarters of the Daily Volume
Source: Dune
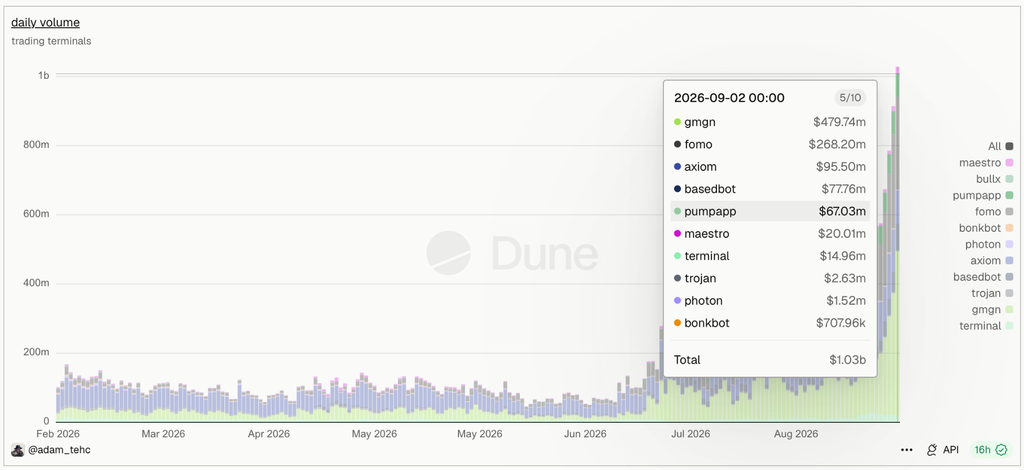
Gmgn drew in $479.74 million in volume on the day while fomo handled $268.20 million. That comes up to $747.94 million processed by the two terminals alone or roughly 73% of all terminal volume during the record day.
Every other terminal notched up numbers that were only a fraction of the activity. Axiom came in at $95.50 million, basedbot at $77.76 million and pumpapp at $67.03 million. Maestro managed $20.01 million and terminal $14.96 million.
Notably, the terminals that dominated the market share during the 2024 and early 2025 memecoin cycle have fallen down the pecking order. Trojan did $2.63 million, Photon did $1.52 million and BonkBot did $707,960. All three combined came to under $5 million on a day the category cleared a billion, which works out to less than half a percent of total flow.
Robinhood Chain Accounted for 81% of All Terminal Volume
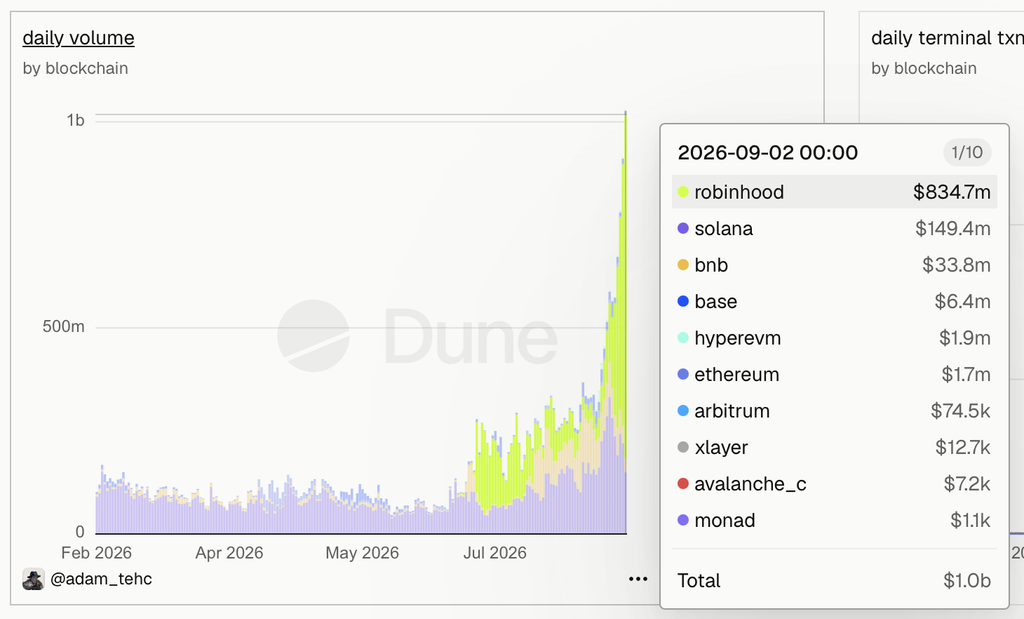
When we turn our attention to the daily volume by blockchain, it becomes very clear where this growth is coming from. Robinhood Chain accounted for $834.7 million of Wednesday’s total, or 81.2% of terminal volume. Solana came second with $149.4 million, or 14.5%. BNB Chain took $33.8 million at 3.3%.
Line the two charts up and the overlap is hard to miss. gmgn and fomo’s combined $747.94 million sits close to Robinhood Chain’s $834.7 million total. That points to chain placement doing the heavy lifting rather than any product feature these terminals have that their competitors do not. The winners are the ones routing into where the flow is, and right now that is Robinhood Chain.
Solana’s Dollar Volume Did Not Shrink, the Denominator Grew Around It
The market share chart makes Solana look like it collapsed, dropping from a purple block that held 80% or more of the category through February and April to 14.5% on Wednesday. That reading is misleading.
Solana’s $149.4 million is roughly in line with what it was doing across the February to June stretch, when total terminal volume was sitting somewhere between $50 million and $150 million a day. Its absolute dollar volume held. Robinhood Chain simply arrived and added several hundred million dollars of daily flow on top, which compressed everyone else’s percentage without taking anything away from them.
The share chart shows the shift starting in July, with the light green Robinhood Chain band expanding through August before Wednesday’s spike pushed the total past a billion.
What the Number Measures
Terminal volume is DEX flow attributed to whichever front-end initiated the trade. It is a measure of where retail is routing orders, not a count of new onchain activity that would not have happened otherwise. A trade that would have gone through a wallet or an aggregator still shows up here if a terminal sent it.
That makes Wednesday’s print a read on distribution more than demand. Retail is still trading. It has moved to a different set of doors, and those doors happen to open onto Robinhood Chain.
The smartest crypto minds already read our newsletter. Want in? Join them.