Token burns are a common way for crypto projects to manage supply. A burn permanently removes coins from circulation, which lowers the amount available under a project’s rules. This guide gat
Token burns are a common way for crypto projects to manage supply. A burn permanently removes coins from circulation, which lowers the amount available under a project’s rules.
This guide gathers the key cryptocurrency burn statistics for 2026. It covers BNB, Ethereum, XRP, Avalanche, Solana and Shiba Inu, and it explains what each number does and does not show.
The largest recent figure comes from BNB. On 19 October 2026, the BNB Foundation announced that 1,646,196.44 BNB had been burned, worth about $1.197 billion at the time.
Burn numbers are easy to misread. A large headline figure can be a tiny share of supply, and a burn does not always lift a price. Each section below adds the context needed to read the data.
Key Cryptocurrency Burn Statistics at a Glance
The table below lists the main figures used in this guide. Most are reported numbers from official sources. Worked examples appear later and are labeled as hypothetical.
Statistic
Figure
BNB burned on 19 October 2026 (37th quarterly burn)
1,646,196.44 BNB
Approximate value of that burn
$1.197 billion
BNB total supply after the burn
131,512,085 BNB
BNB long-term supply target
100 million BNB
BNB burn as a share of post-burn supply
About 1.25%
Ethereum fee burning began (EIP-1559)
August 2021
XRP standard minimum transaction cost
0.00001 XRP
Avalanche maximum issuance
720 million AVAX
Solana base fee burned
50%
Solana priority fees burned
0%
Bitcoin supply limit
About 21 million BTC
Supply sizes vary widely between projects. XRP started with 100 billion tokens, and Shiba Inu launched with one quadrillion. BNB started with 200 million, and Bitcoin is limited to about 21 million.
Because of these gaps, raw burn counts are hard to compare. A burn of one million tokens means something very different for each project. Percentages give a fairer picture.
Bitcoin has no scheduled burn program like BNB’s. Lost private keys can make coins unreachable, but that is different from a recurring protocol burn.
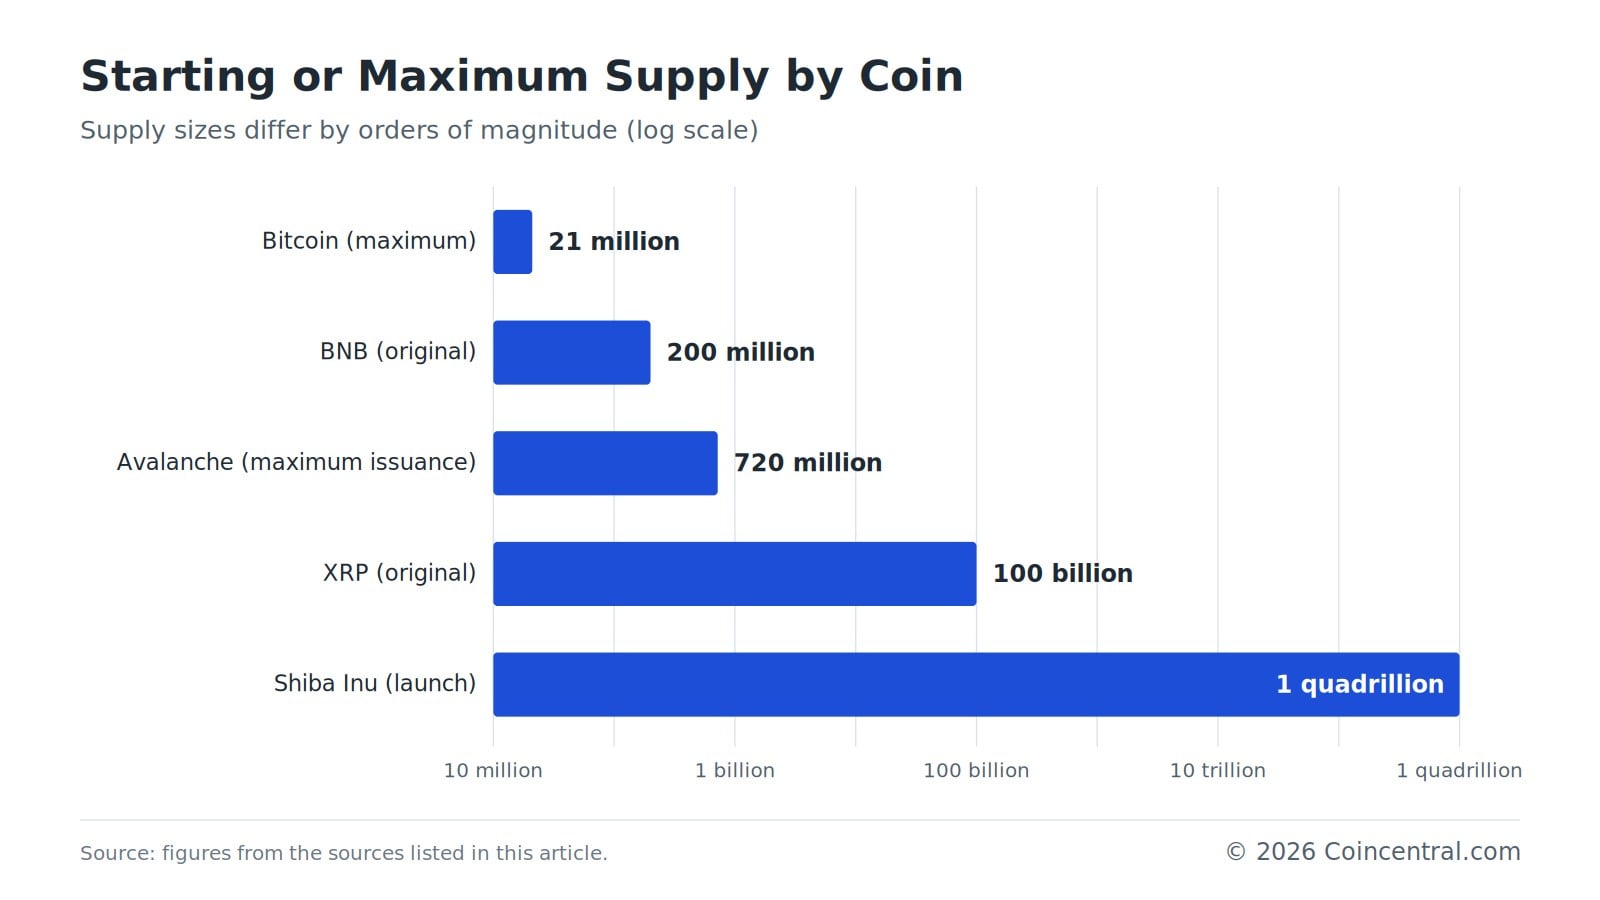
Figure 1: Starting or maximum supply for five cryptocurrencies, shown on a log scale.
How Token Burns Work: The Basic Numbers
A token burn permanently removes coins from the supply. Tokens are either sent to an address nobody can access or destroyed through a smart contract function.
A common Ethereum-compatible burn address is 0x000000000000000000000000000000000000dEaD. It is often called the dead address. Transfers to it are public, so anyone can check them.
There is a technical catch. Sending an ERC-20 token to a dead address does not always lower the contract’s reported totalSupply() figure. The tokens still count as existing even though nobody can use them.
Other tokens use a built-in burn function. OpenZeppelin’s standard ERC-20 code includes an internal _burn function that lowers the recorded supply. Solana’s Token Program has burn instructions that reduce both the account balance and the mint’s total supply.
Projects burn tokens for several reasons. They may want to cut supply, offset newly issued tokens, tie supply to network use or follow a public plan. A burn on its own does not prove strong demand or a healthy business.
Burns come in several forms. These include scheduled burns such as BNB’s quarterly program, fee burns such as Ethereum’s, buyback-and-burn programs, community burns and automatic protocol burns. Automatic burns can be easier to trust because the protocol enforces the rules.
A worked example
Measurement
Before burn
After burn
Total token supply
100 million
90 million
Tokens burned
0
10 million
Share of original supply removed
0%
10%
Tokens remaining
100 million
90 million
In this example, a project burns 10 million of its 100 million tokens. That removes 10% of the original supply. The effect on tradable supply depends on where the tokens were held.
If the tokens sat in a project treasury, the amount available to trade may barely change. If the project bought them from investors first, the purchase added demand as well as cutting supply.
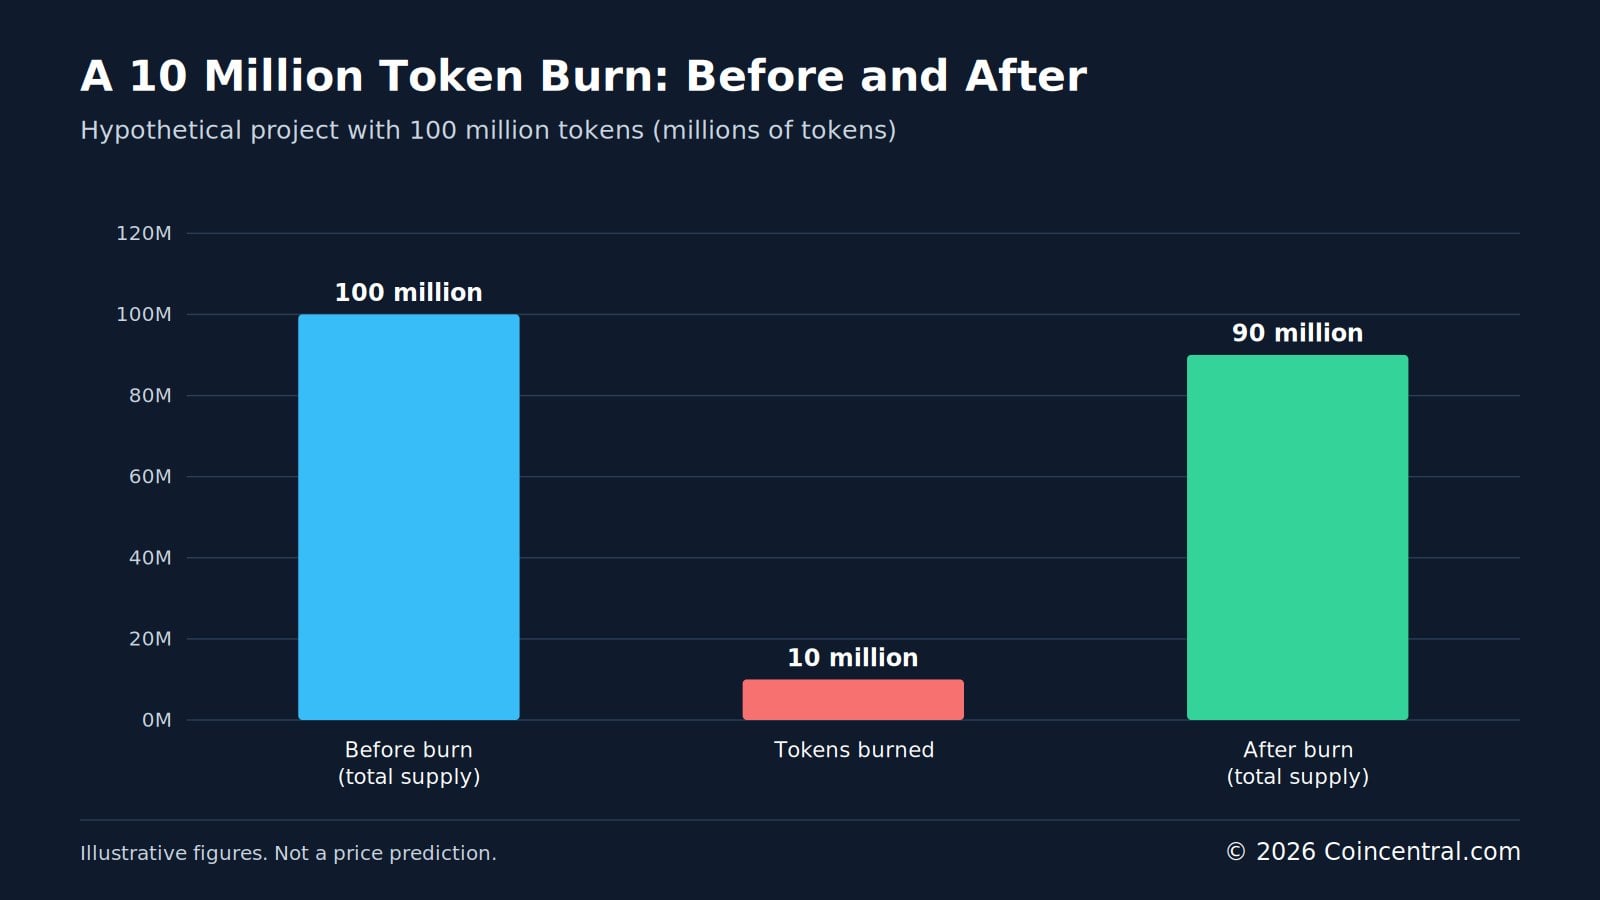
Figure 2: A hypothetical burn of 10 million tokens from a supply of 100 million.
Ethereum Burn Statistics: How EIP-1559 Works
Ethereum began burning part of its transaction fees in August 2021. The London upgrade introduced EIP-1559, which changed how fees are set.
Each fee has two parts. The base fee is permanently burned. The priority fee, also called a tip, goes to the validator that processes the transaction.
A fee burn example
Take a transaction that uses 21,000 gas units with a base fee of 10 gwei per unit. The burn is 21,000 × 10 gwei, or 210,000 gwei.
That equals 0.00021 ETH. At a hypothetical ETH price of $4,000, the burn is worth about $0.84.
Transactions
ETH burned
Value at $4,000 per ETH
1
0.00021
$0.84
100
0.021
$84
10,000
2.1
$8,400
1,000,000
210
$840,000
One burn is small, but the total grows as transactions pile up. The table assumes the same base fee for every transaction, which real networks do not do.
![Log scale bar chart of value burned for 1, 100, 10,000 and 1,000,000 Ethereum transactions]()
Figure 3: Value of ETH burned at different transaction counts, using a hypothetical $4,000 ETH price.
Is ETH deflationary?
Only at times. Ethereum also issues new ETH to reward validators, so supply depends on the balance between issuance and burning.
If more ETH is burned than issued in a period, supply falls. If issuance is higher, supply grows. Ethereum has no permanently fixed maximum supply, and the Ethereum Foundation confirms that network activity affects how much ETH is burned.
BNB Burn Statistics: The 37th Quarterly Burn
BNB runs one of the best-known scheduled burn programs. It launched with 200 million BNB, and the long-term goal is to cut total supply to 100 million.
The Auto-Burn system sets each quarterly amount using factors such as BNB’s price and blockchain activity. On 19 October 2026, the BNB Foundation announced that the 37th burn was complete.
Measurement
October 2026 burn
Tokens destroyed
1,646,196.44 BNB
Approximate dollar value
$1.197 billion
Remaining total supply
131,512,085 BNB
Long-term supply target
100 million BNB
Burn date
19 October 2026
The burn removed about 1.25% of the post-burn total supply. The $1.197 billion figure is the approximate market value of the destroyed tokens at the time.
It does not mean the foundation spent $1.197 billion buying BNB from investors before the burn. This is a common point of confusion in burn headlines.
Using the reported figures, supply has fallen by about 68.5 million BNB from the original 200 million. That is roughly 68.5% of the reduction needed to reach 100 million. These two numbers are calculated from the figures above and are not official statements.
BNB also has a separate real-time burn, introduced through BEP-95. It destroys part of the transaction fees collected on BNB Smart Chain. The Auto-Burn and the fee burn together work to reduce supply.
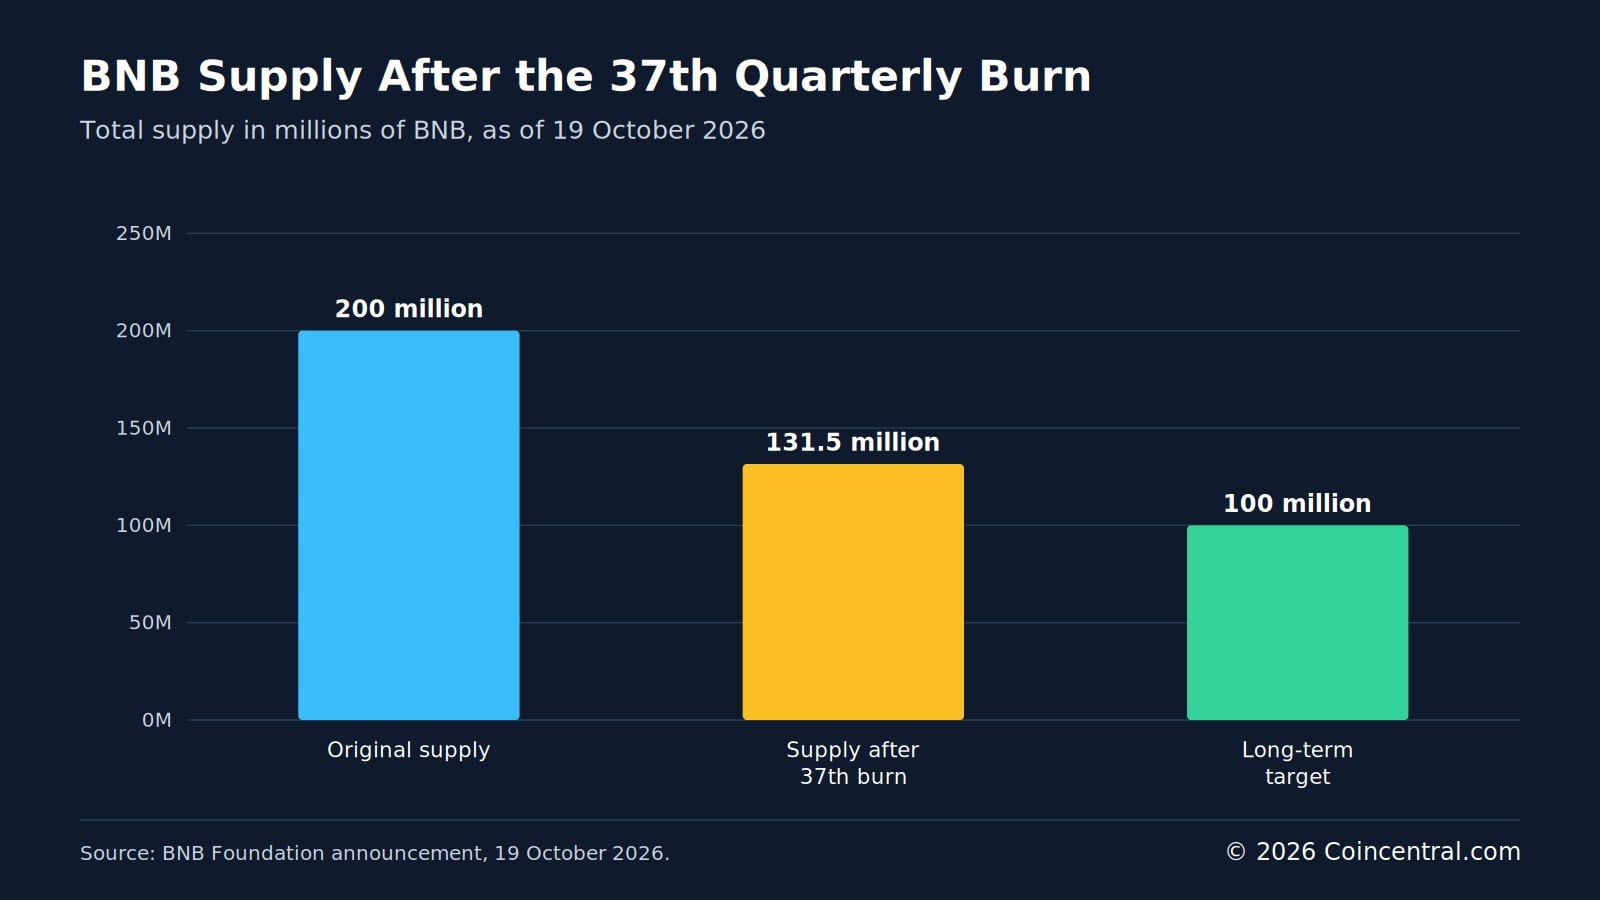
Figure 4: BNB total supply compared with its original level and long-term target.
Shiba Inu Burn Statistics: Why Headline Numbers Can Mislead
Shiba Inu uses community burns and mechanisms linked to its wider ecosystem. SHIB launched with a supply of one quadrillion tokens, and that large supply is a common topic in price discussions.
Burning reduces the number of SHIB available. How much that matters depends on how many tokens are destroyed compared with the total supply.
A percentage example
Suppose a coin has 500 trillion tokens in circulation. A project announces that it has burned one billion. That sounds large, but it is only 0.0002% of the assumed supply.
Tokens burned
Share of 500 trillion supply
1 billion
0.0002%
1 trillion
0.2%
50 trillion
10%
This is a hypothetical case and does not describe an actual SHIB burn. It shows why the percentage matters more than the count. A project can announce millions or billions of destroyed tokens without changing supply in a meaningful way.
Readers should ask what share of supply was removed, not only how many tokens. The same rule applies to every project in this guide.
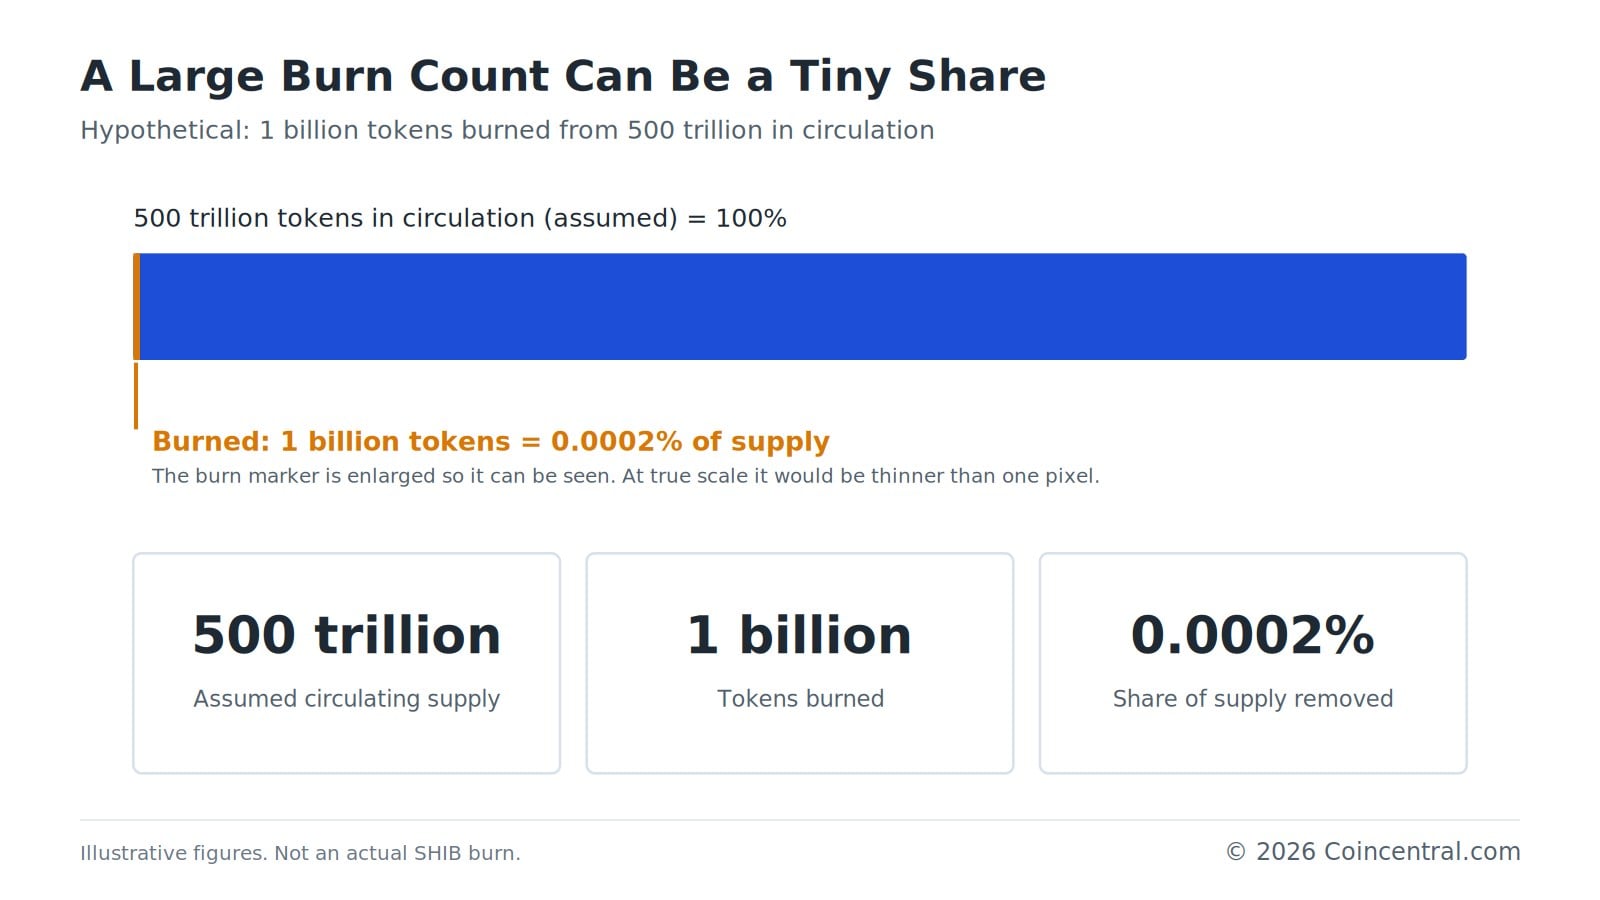
Figure 5: A burn of one billion tokens is 0.0002% of an assumed 500 trillion supply.
Fee Burn Statistics: XRP, Avalanche and Solana
Several networks tie burns to everyday use. Each one handles fees in its own way, so the numbers differ.
XRP Ledger
The XRP Ledger destroys a small amount of XRP with most transactions. The standard minimum cost is generally 0.00001 XRP, and it can rise when the network is busy.
Unlike many blockchains, the XRP Ledger does not pay these fees to validators. The XRP is destroyed. The main goal is to discourage spam and make attacks that rely on heavy activity more costly.
XRP started with 100 billion tokens, so the supply reduction from these fees is usually small.
Avalanche
Avalanche also burns fees. Its documentation says AVAX used for applicable network fees is permanently removed. At the same time, the network creates new AVAX to reward validators, up to a maximum issuance of 720 million.
So burning does not automatically make AVAX deflationary. Supply changes depend on new rewards and the amount destroyed.
Solana
On Solana, 50% of the standard base fee is burned. The other 50% goes to the validator that produced the block. Since SIMD-0096, 100% of priority fees go to validators.
It is therefore wrong to say that half of every Solana fee is burned. Only the base fee portion is split this way.
Network
What is burned
Where the rest goes
Ethereum
Base fee
Priority fee goes to the validator
Solana
50% of the base fee
Other 50% and all priority fees go to validators
XRP Ledger
Transaction cost (0.00001 XRP minimum)
Not paid to validators
Avalanche
Applicable network fees
New AVAX is issued as rewards, up to 720 million
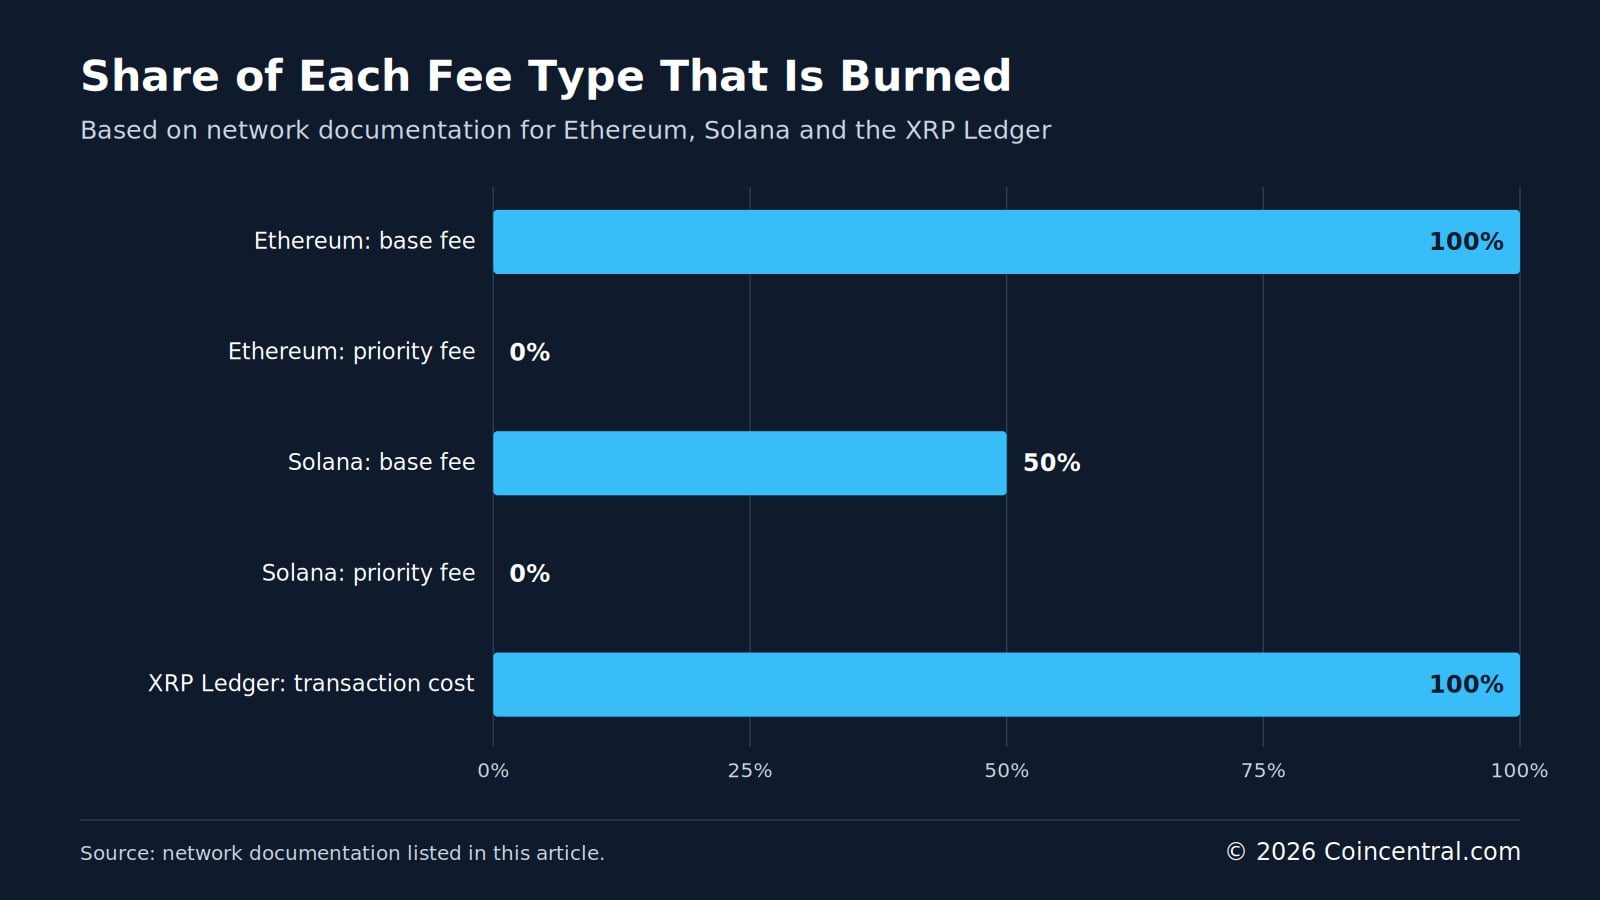
Figure 6: Share of each fee type that is burned on Ethereum, Solana and the XRP Ledger.
Do Burns Raise Prices? What the Math Shows
Basic economics says that if demand stays the same and supply drops, the price may rise. Crypto markets are less simple. Investors often expect scheduled burns months ahead, so the effect may already be in the price.
A burn can also happen during a market decline, when selling outweighs any positive effect. A burn alone cannot create demand.
A 10% burn example
Suppose a coin has 100 million tokens, a price of $1 and a market cap of $100 million. The project burns 10 million tokens, which leaves 90 million.
If the price stays at $1, the market cap falls to $90 million. If investors still value the coin at $100 million in total, the price becomes about $1.11, a rise of roughly 11.1%.
Scenario
Supply
Price
Market cap
Before burn
100 million
$1.00
$100 million
After burn, same price
90 million
$1.00
$90 million
After burn, same market cap
90 million
$1.11
$100 million
This is a math illustration, not a forecast. Holding the market value steady after a burn is an assumption, not a rule. Actual prices depend on trading activity, demand and market conditions.
Academic research in Economics Letters (April 2025) looks at how markets react to cryptocurrency announcements, including returns, trading volume and volatility. It is a useful reminder that price moves around news come from more than one factor.
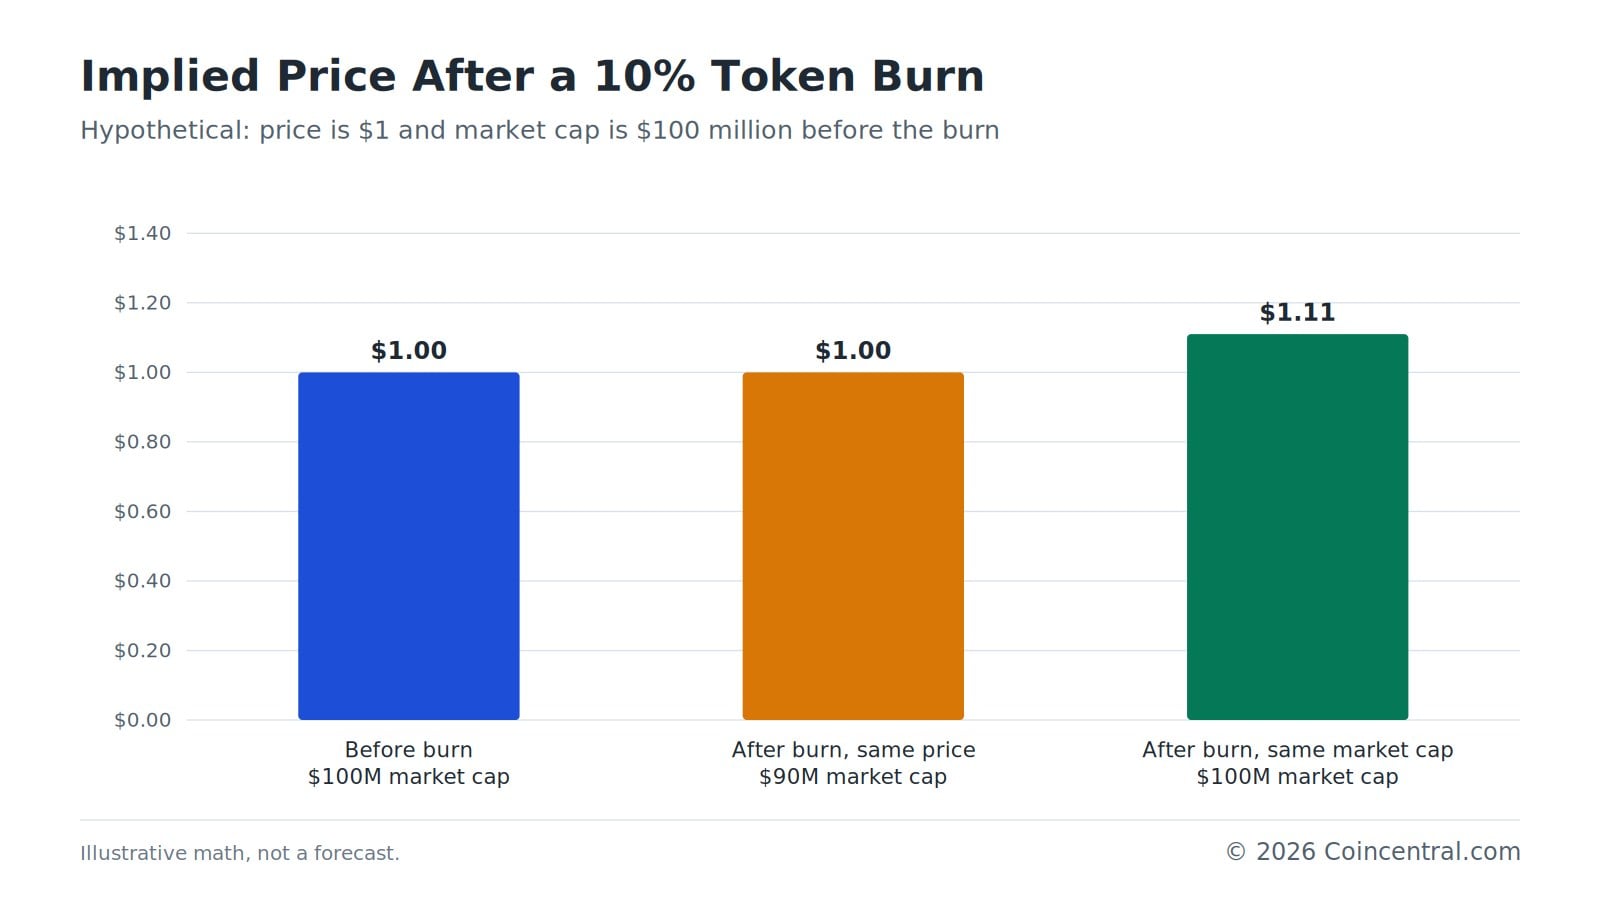
Figure 7: Implied token price in two scenarios after a 10% burn.
Burn vs Inflation: Net Supply Statistics
Burning and inflation work in opposite directions, but one coin can have both. Inflation adds new units, which can dilute holders’ share of the supply. Burning removes units.
Supply activity
Tokens
Starting supply
100 million
New staking rewards issued
+5 million
Tokens burned
-3 million
Ending supply
102 million
Net supply increase
2%
Despite the burn of three million tokens, supply rose 2%. The burn slowed growth but did not make the asset deflationary.
This matters for networks that keep paying staking rewards, such as Ethereum and Avalanche. Investors should compare net supply change rather than treat every burn as proof of falling supply.
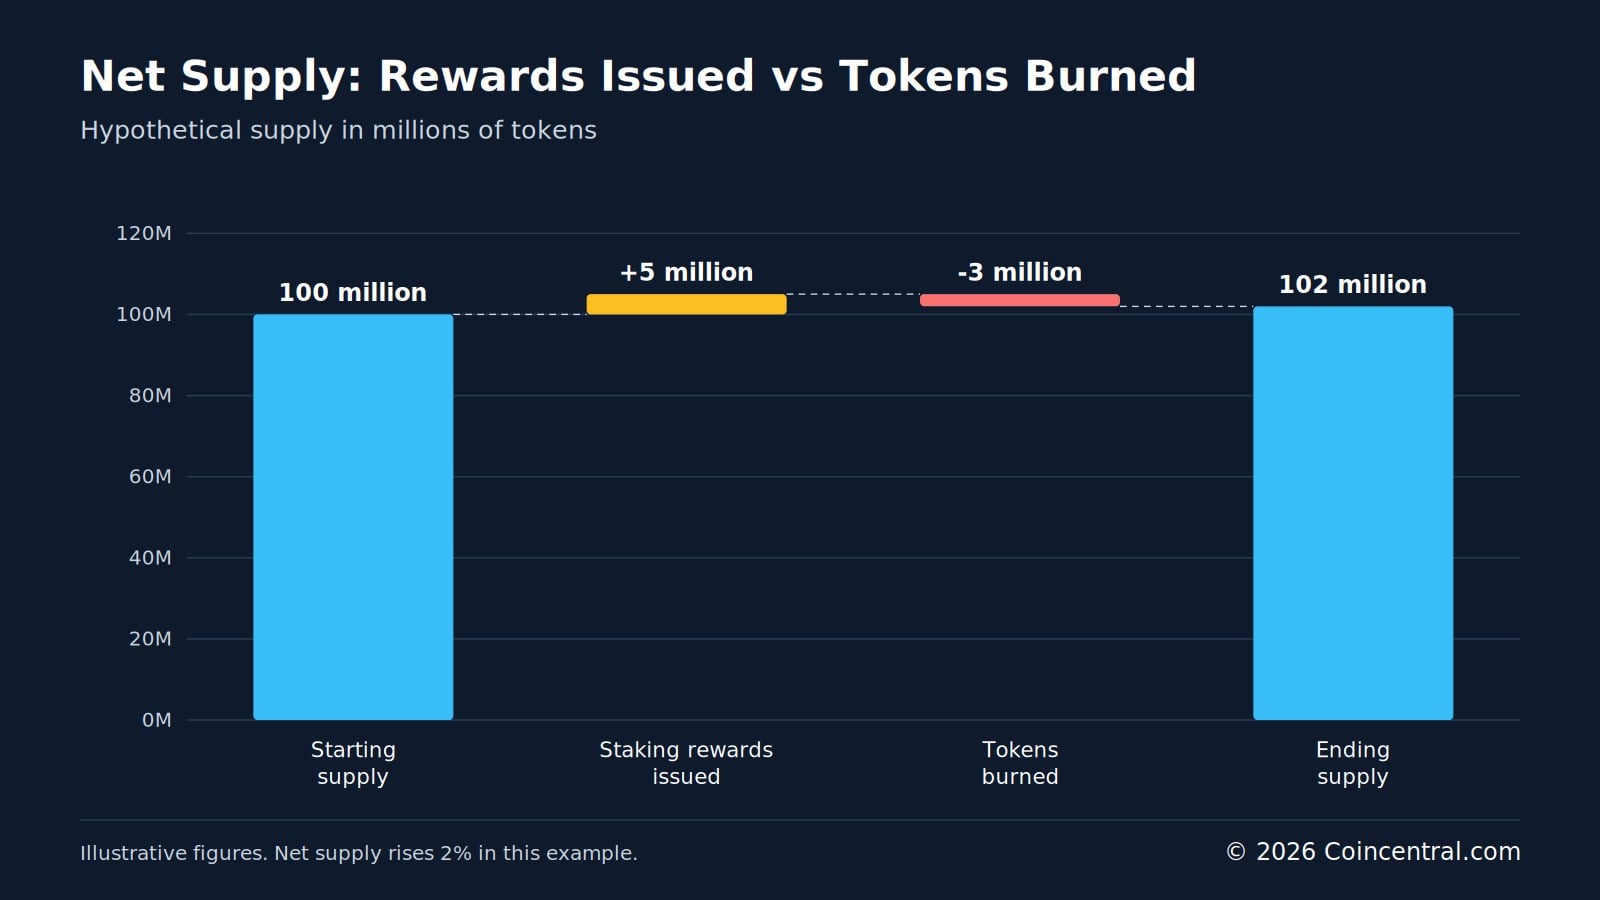
Figure 8: A hypothetical coin issues 5 million tokens and burns 3 million, so supply grows 2%.
Misleading Burns: Total Supply vs Tradable Supply
Burn announcements can create excitement without much change to the economics. One common issue is burning tokens that were never in circulation.
Say a project creates one billion tokens and keeps 900 million in its treasury. It burns 500 million treasury tokens and announces a 50% cut in total supply.
Measure
Before burn
After burn
Total supply
1 billion
500 million
Treasury holdings
900 million
400 million
Tokens held outside the treasury (assumed)
100 million
100 million
Total supply falls by half. If the other 100 million tokens are held by the public, the amount available to trade does not change.
Other warning signs include the following.
- Burning tokens while keeping unrestricted minting rights.
- Announcing future burns that never happen.
- Overstating the dollar value of destroyed tokens.
- Presenting small burns as large supply cuts.
- Using burn news to attract buyers before insiders sell.
These are not automatically fraud, but they show why burn news deserves a close look. The US Securities and Exchange Commission has warned that crypto promoters may use misleading claims and social media campaigns to push up prices before selling their own holdings.
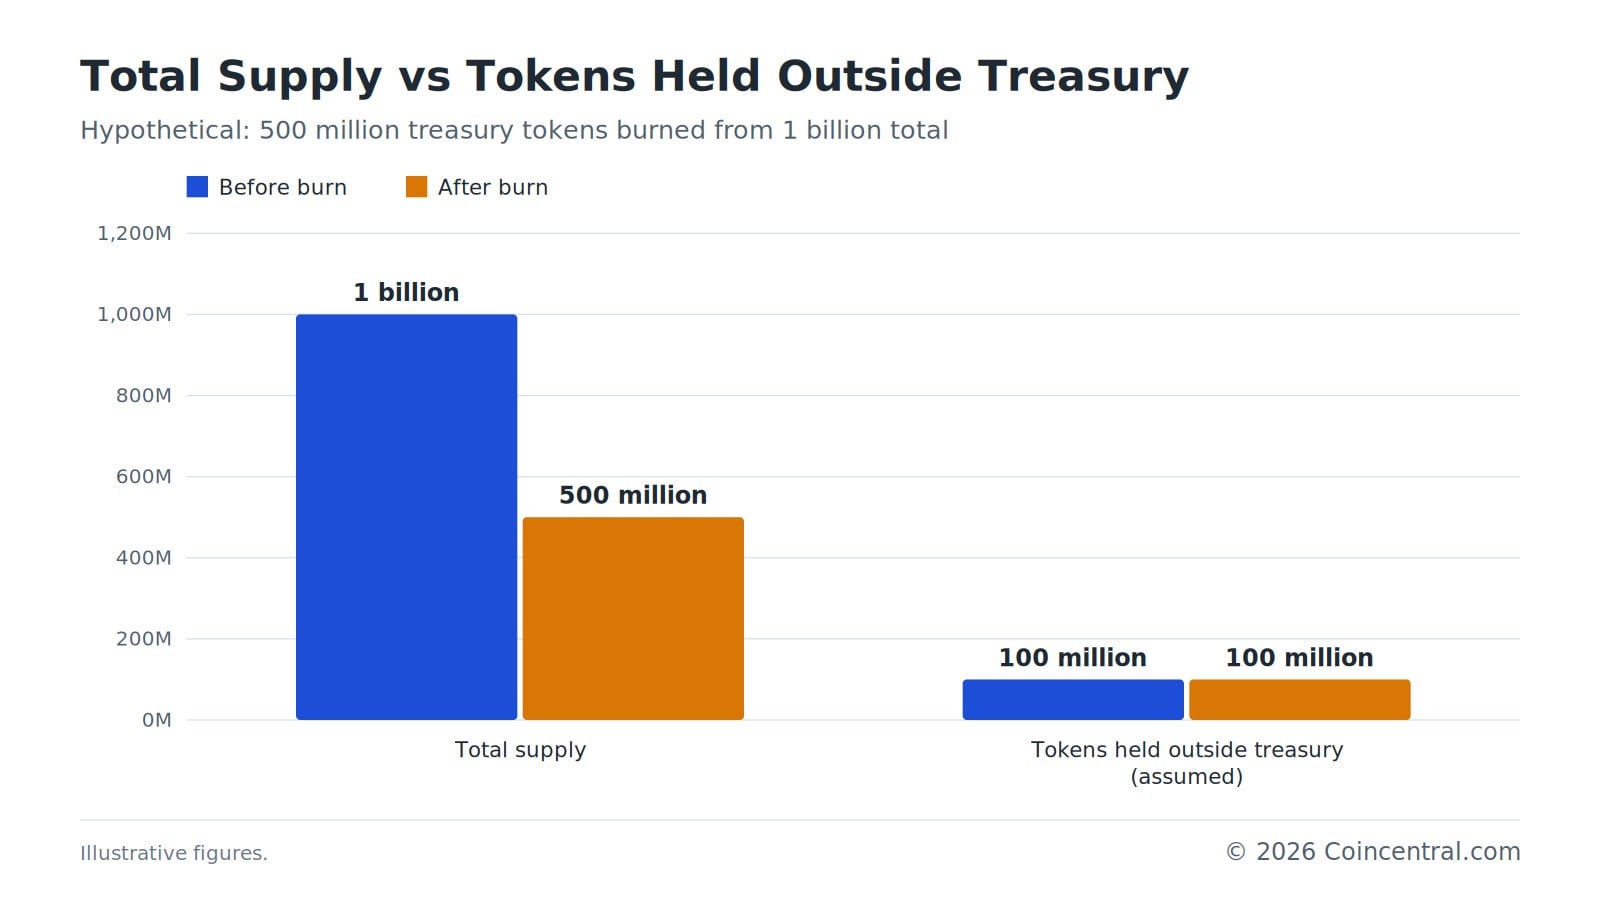
Figure 9: A treasury burn can cut total supply by half and leave tradable supply unchanged.
How to verify a burn
Most real burns can be checked. Etherscan covers Ethereum-based tokens, and BscScan covers BNB Smart Chain. Find the official token contract, then look at the transaction hash, the amount, the destination address and the resulting supply change.
Question
Why it matters
Was the burn completed?
Announcements are not proof of execution
How many tokens were destroyed?
Sets the actual reduction
What share of supply was removed?
Gives economic context
Were the tokens circulating before?
Shows the effect on available supply
Can more tokens be minted?
Future issuance could offset the burn
Investors should also tell apart a true cut in a contract’s total supply from tokens sent to an inaccessible address. CoinGecko’s October 2026 methodology separates maximum supply, total supply and tokens permanently removed from circulation, which can change reported market caps.
Stablecoin, Buyback and Liquidity Burns
Stablecoins
Circle mints new USDC when eligible customers deposit US dollars. When they redeem USDC for dollars, the matching tokens are burned.
If a qualifying business redeems $10 million of USDC, the issuer can burn $10 million of tokens and release the matching reserve assets. This lowers USDC supply but does not make each remaining token worth more. USDC is designed to stay near $1.
Buybacks
A buyback purchases tokens. A burn removes them. A project can burn treasury tokens without buying anything, or it can buy tokens from investors and then destroy them.
The second path adds demand along with the supply cut. It also has a cost, because a project that spends large treasury funds on repurchases has less for development and operations.
Liquidity burns
Burning LP tokens is different from burning a coin. LP tokens represent a share of a trading pool. Making them inaccessible can stop liquidity from being withdrawn, which may lower some rug-pull risks.
It does not reduce the circulating supply of the coin being traded. The word burn also describes the normal redemption of LP tokens when liquidity is withdrawn, so the transaction itself should be checked.
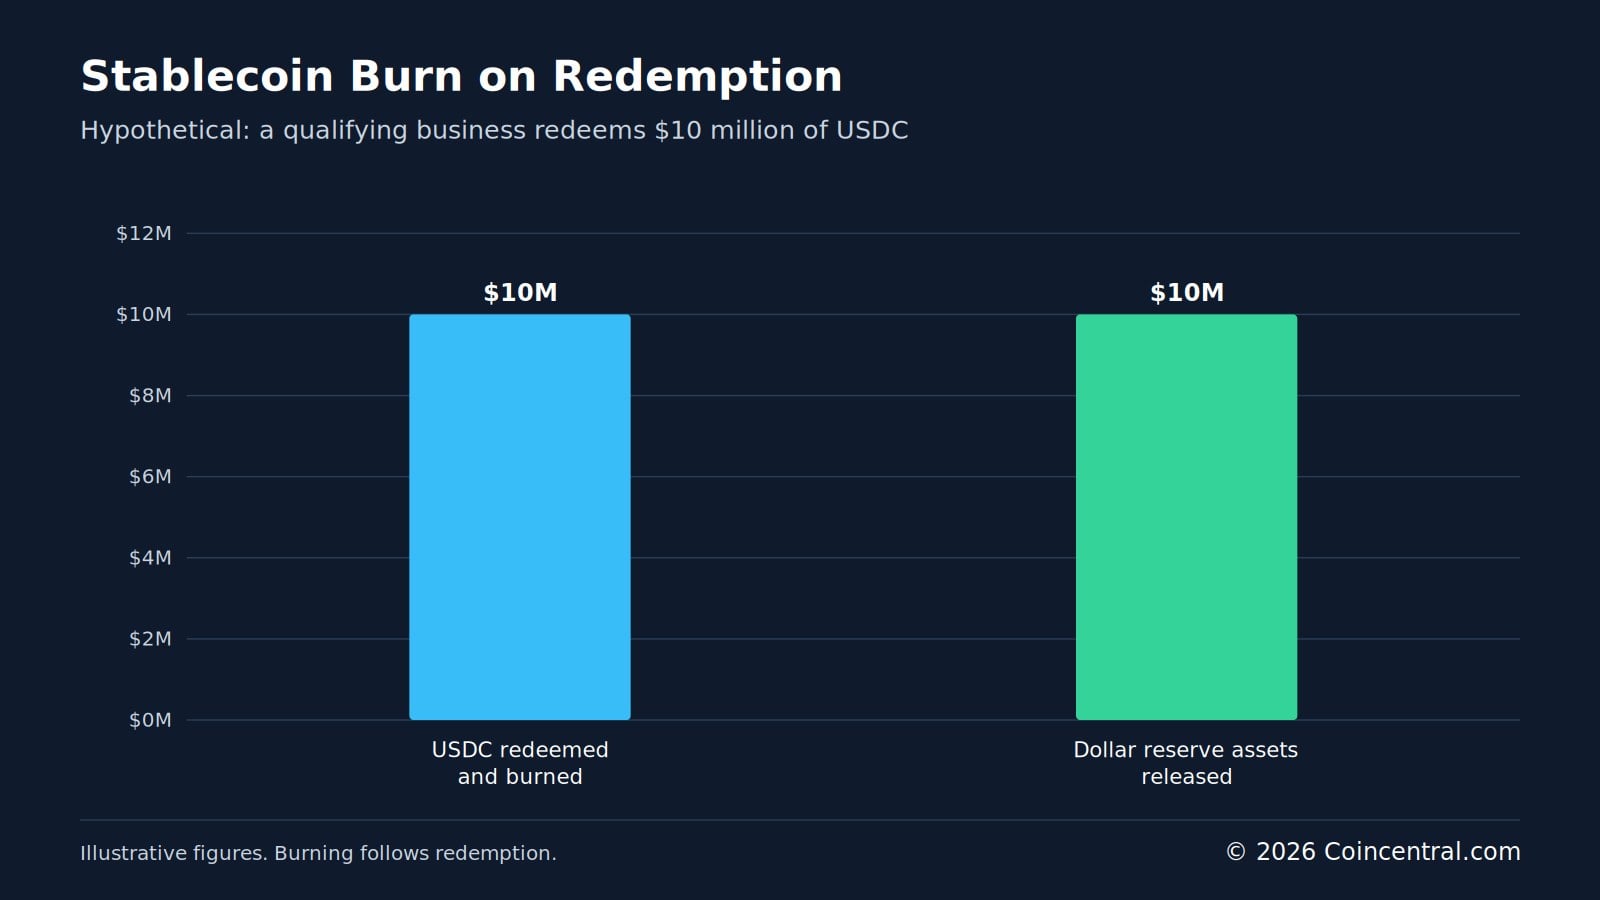
Figure 10: A USDC redemption burns tokens and releases matching reserve assets.
Bottom Line: What the Burn Numbers Tell Investors
Token burning permanently removes coins from circulation, but the effect depends on how the burn works and which tokens are destroyed. Ethereum burns base fees, and BNB combines quarterly burns with a fee burn. XRP, Avalanche and Solana use fee-related systems.
BNB’s October 2026 burn is the largest recent figure in this guide, at about $1.2 billion. That value should not be mistaken for money spent buying coins on the open market.
The most useful measure is how a burn changes circulating supply, future issuance and the value of the remaining tokens. The chart below compares the share of supply removed in the examples used here.
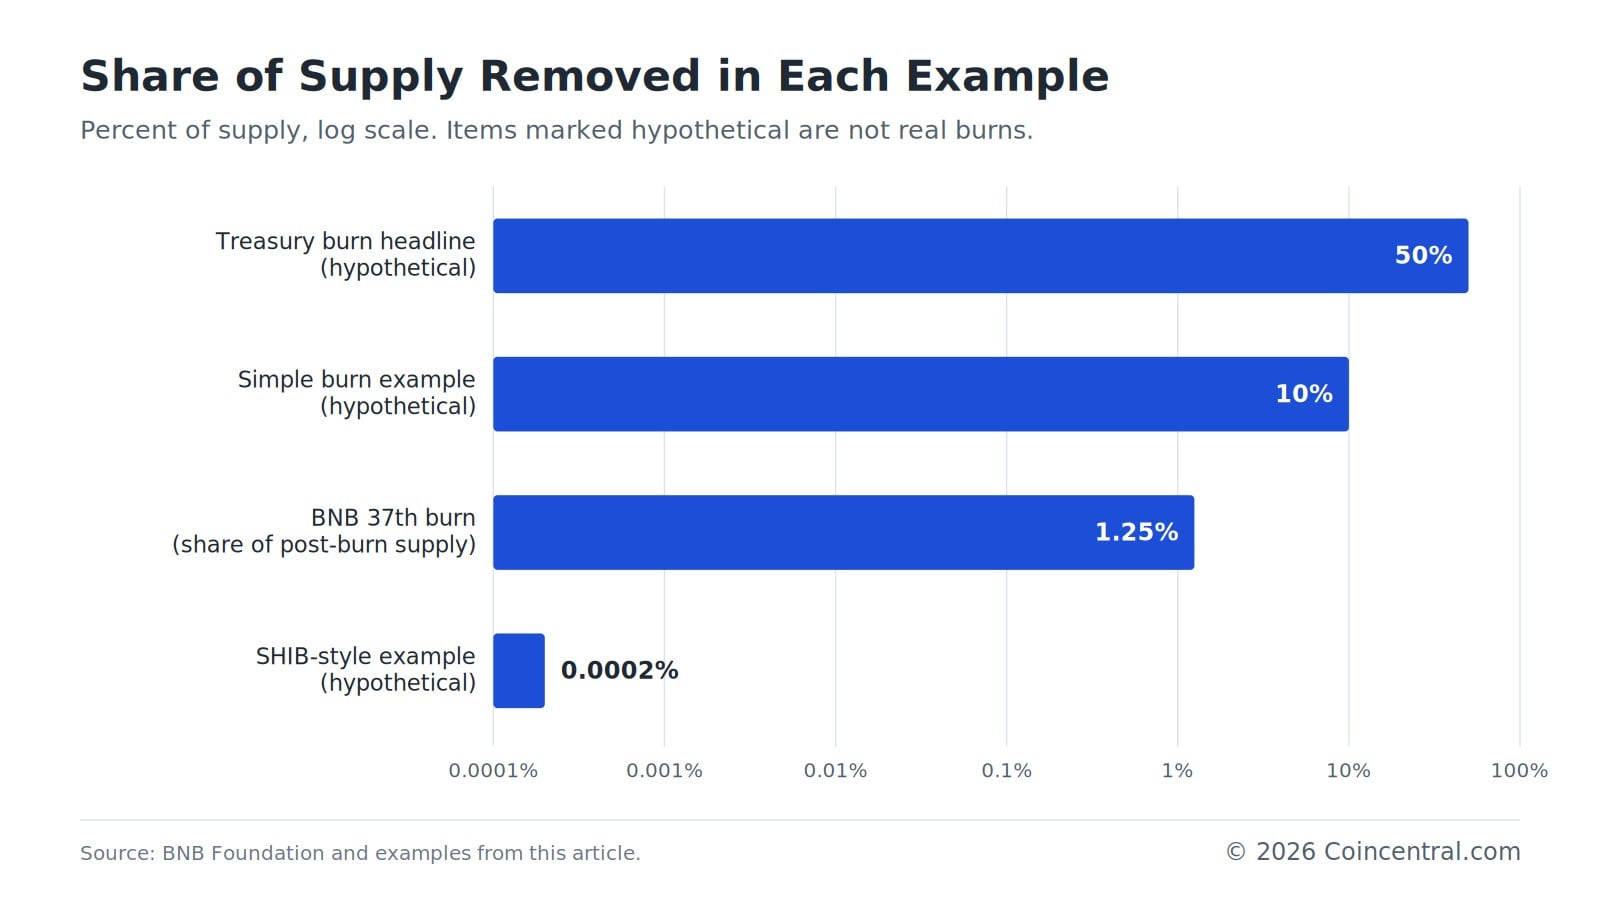
Figure 11: Share of supply removed in the examples used in this guide.
Investors can check burns on the blockchain, read the project’s supply rules and ask whether the cut is large enough to matter. A credible burn can strengthen a coin’s economics, but it does not replace research into demand and the project itself.
Disclaimer: This article is for educational and informational purposes only and does not constitute financial or investment advice. Cryptocurrency supply figures, burning mechanisms and market conditions can change. Illustrative calculations are not price predictions or guarantees of future returns.
Sources
- Ethereum Foundation: Ethereum EIP-1559: Transaction Fee Burning, technical specification of Ethereum’s base-fee burning mechanism.
- Ethereum Foundation: How Ethereum Creates and Burns ETH, ETH issuance, validator rewards and transaction burns.
- Ethereum Foundation: Ethereum Supply After the Merge, the relationship between new issuance and token destruction.
- BNB Foundation (19 October 2026): 37th Quarterly BNB Burn, latest official burn figures and supply reduction.
- BNB Chain: BNB Auto-Burn Mechanism, quarterly burn calculations and the 100 million BNB target.
- XRP Ledger: XRP Transaction Fees and Token Burning, XRP destruction through network transaction fees.
- Avalanche: AVAX Tokenomics and Fee Burning, maximum supply, staking rewards and fee burns.
- Solana Foundation: Solana Transaction Fee Structure, base-fee burning and validator priority fee allocations.
- Shiba Inu: SHIB Token Burning Mechanisms, community and ecosystem burning arrangements.
- OpenZeppelin: ERC-20 Smart Contract Burning Functions, technical implementation of token minting and burning.
- Solana Foundation: Burning Tokens on Solana, token burning instructions and supply reductions.
- CoinGecko (October 2026): Cryptocurrency Supply Calculation Methodology, maximum supply, total supply and burned tokens.
- Circle: USDC Minting and Burning Explained, stablecoin issuance, redemption and token destruction.
- Uniswap: Liquidity Pool Tokens and Burning, liquidity-provider tokens and redemption mechanisms.
- US Securities and Exchange Commission: Cryptocurrency Investment Scam Warning, risks involving misleading promotional claims and market manipulation.
- Economics Letters (April 2025): Market Reactions to Cryptocurrency Announcements, academic research on cryptocurrency announcements, market returns, trading volume and volatility.
The post Cryptocurrency Burn Statistics 2026: Key Numbers Every Investor Should Know appeared first on Blockonomi.