Will Dash going to hold the $37.47 support level or slide to the next support level? This Dash price prediction begins with DASH trading under its broken October range, a band price held for
Will Dash going to hold the $37.47 support level or slide to the next support level?
This Dash price prediction begins with DASH trading under its broken October range, a band price held for weeks. Theearlier Dash price analysis tracked that zone, and sellers have kept control since. A spot delisting on MEXC adds a fresh test.
Dash Price Forecast: 24-Hour Snapshot
PerCoinGecko market data, DASH ranks 100th by market cap.
Metric
Figure
Price
$39.24
7-day change
-12.3%
Market cap
$503.738M
Market cap rank
100th
24-hour volume
$42.196M
Circulating supply
12.894M DASH
Total supply
12.894M DASH
Max supply
18.92M DASH
Source: CoinGecko, DASH market snapshot, captured Nov 13, 2026, 5:40 UTC
Fully diluted valuation, counts every coin at the current price. Here it sits $15K above market cap, since circulating and total supply match at 12.894M. About 68.2% of the 18.92M max supply already circulates.
Dash MEXC Delisting News: Spot Trading Stops Today
A delisting means an exchange removes a trading pair, so traders can no longer buy or sell that coin there. Per theofficial MEXC announcement, the DASH and XMR spot pairs stop trading later today.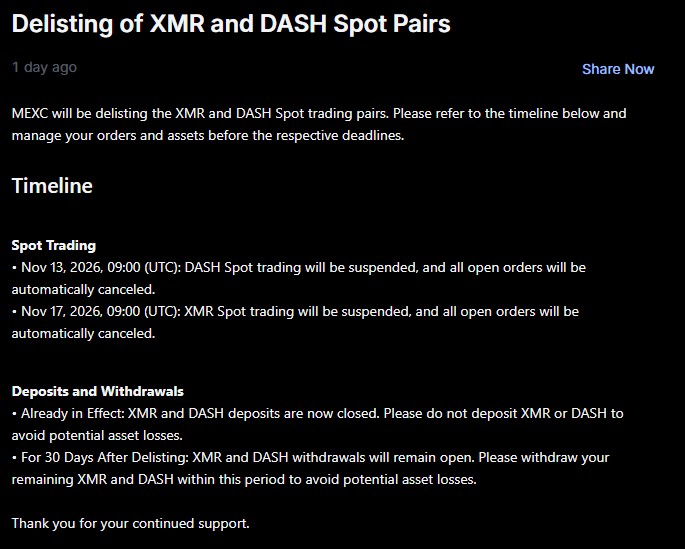
Source: MEXC announcement, captured Nov 13, 2026, 5:40 UTC
The notice is one day old, but the suspension lands hours after the snapshot. Holders get 30 days to withdraw.
For this Dash price prediction, the Dash MEXC delisting matters for liquidity, not valuation. Broadercrypto news coverage on exchange listings adds context. Fewer venues can still thin the order book and widen price swings.
Dash Liquidation Data: $652.23K Wiped, 98% Longs
Longs got flushed. PerCoinGlass futures data, $652.23K of DASH positions were liquidated over 24h, 98% of them longs. A liquidation is a forced exit from a leveraged trade when margin runs out.
Window
Total
Longs
Shorts
1h
$41.74K
$41.62K
$116.09
4h
$376.44K
$373.85K
$2.59K
12h
$388.29K
$375.82K
$12.47K
24h
$652.23K
$638.07K
$14.16K
Source: CoinGlass, DASH liquidations, captured Nov 13, 2026, 5:40 UTC
Shorts lost just $14.16K over 24 hours. About 58% of the total hit in the last 4 hours, or $376.44K. Another $41.74K in the last hour, all longs.
Long liquidations become forced market sell orders, which add pressure while the price sits near support.
Dash Open Interest and Volume: 24h Exchange Data
Open interest is the total value of futures contracts still open. CoinGlass shows $45.65M across exchanges over 24h, with every venue on the heatmap in red.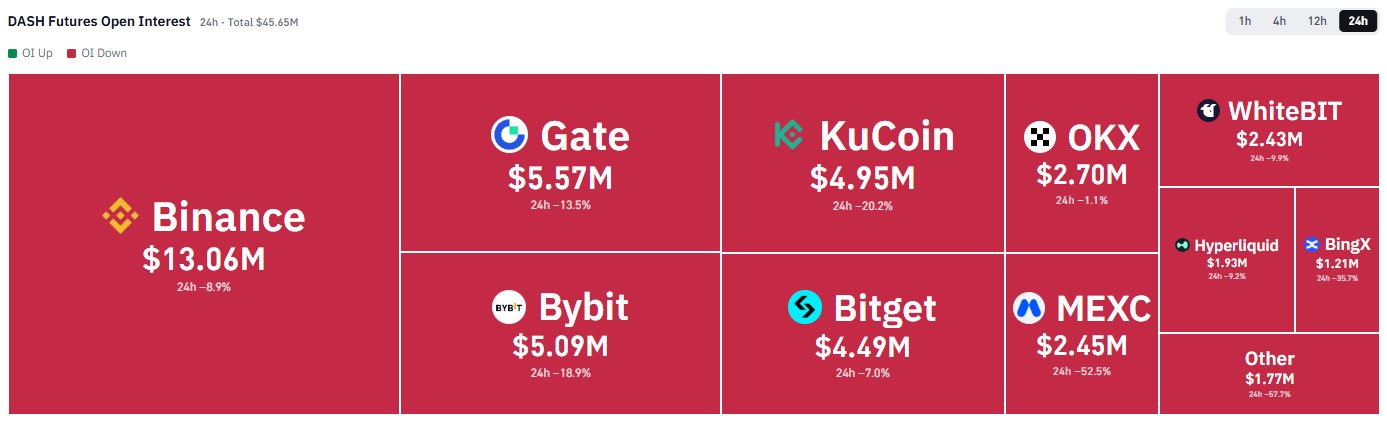
Source: CoinGlass, DASH futures open interest, captured Nov 13, 2026, 5:40 UTC
Binance shows $13.06M, down 8.9%. The gate shows $5.57M, down 13.5%.
Falling open interest alongside falling price can simply mean longs are flushed, not that bears are piling in. With every venue red.
Futures volume tells a similar story. CoinGlass shows $66.93M traded over 24 hours. Binance volume was $26.49M, down 16.7%.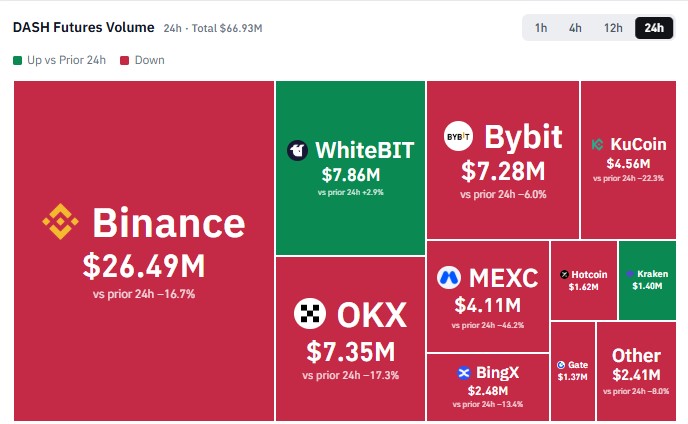
Source: CoinGlass, DASH futures volume, captured Nov 13, 2026, 5:40 UTC
WhiteBIT volume was $7.86M, up 2.9%. MEXC volume dropped 46.2% to $4.11M, and its open interest fell 52.5%, while the delisting notice was live. Kraken also posted gains.
Falling open interest and volume during a drop mean traders are exiting positions, not adding buyers at lower levels.
Dash Technical Analysis: 50-Day EMA and RSI Levels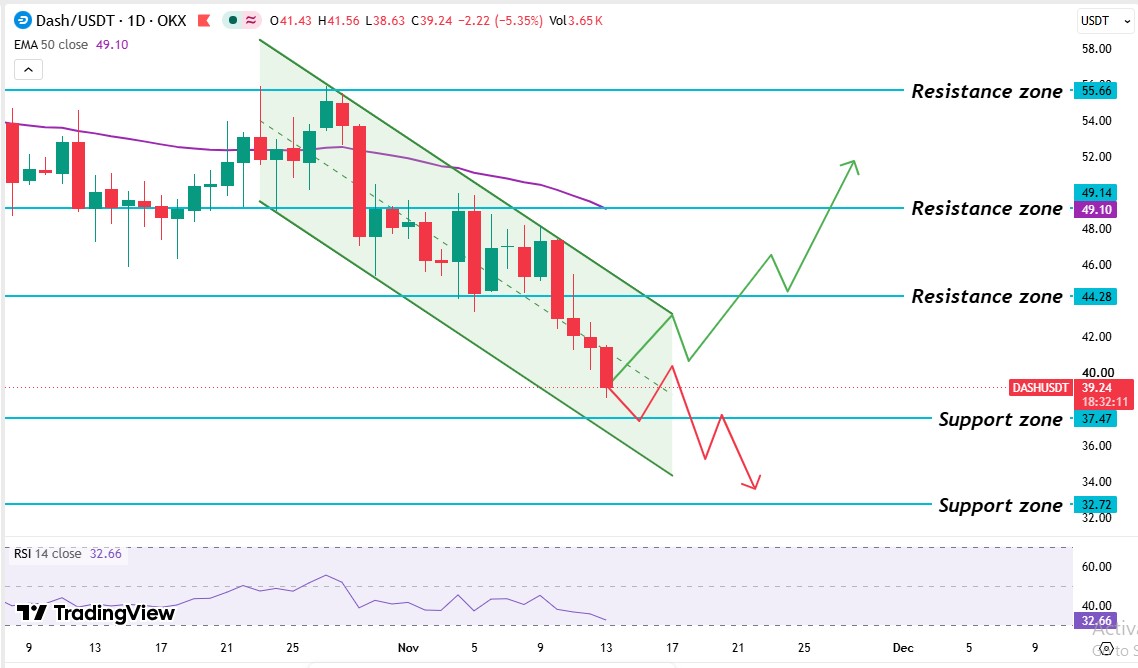
Source: TradingView, DASH/USDT 1D chart on OKX with EMA 50 and RSI 14, captured Nov 13, 2026, 5:40 UTC
The OKX 1D chart for DASH/USDT on TradingView frames this Dash price prediction. A late-October drop pushed DASH down from $55.66 before sellers took control.
In October, the price traded in a range, a band held between a support level at $49.14 and a resistance level at $55.66. A sharp drop then broke the $49.14 level and the 50-day EMA level, an average of recent prices that weighs the latest days more.
In early November, buyers tried several times to reclaim the $49.14 level and failed. That retest echoes arecent breakout analysis, only with sellers winning each round. A second sharp drop broke the $44.28 support level, and the price has slid inside a descending channel, two downward-sloping trend lines.
Right now, DASH trades above the $37.47 support level, where buyers need to step in, and below both the $44.28 resistance level and the 50 EMA level.
The Dash 50-day EMA sits at $49.10, where sellers have defended. DASH's $39.24 price trades 20.4% below it. The broken $49.14 level sits near it, so a real recovery needs a candle trading above both levels.
The Dash RSI reads 32.66 on the 14-day setting.Under 50 means sellers hold the edge, and above 30 means oversold conditions haven't formed, so price has room to fall.
Dash Support and Resistance Levels
Level
Type
$55.66
Resistance level
$49.14
Resistance level
$49.10
50-day EMA
$44.28
Resistance level
$37.47
Support level
$32.72
Support level
The nearest support level is $37.47, and the nearest resistance level is $44.28.
Dash Price Forecast: Bull, Base, and Bear Scenarios
Scenario
Trigger
Target
Invalidation
Bull
Daily candle above $44.28
$49.10 EMA than $55.66
Falls back below $44.28
Base
Price between $37.47 and $44.28
Sideways trade in the range
Daily candle breaks either level.
Bear
Daily candle below $37.47
$32.72 support level
Daily candle above $44.28
Thin spot liquidity after the MEXC delisting could widen swings. And a rebound that stalls at $44.28 keeps the bear case alive.
Expert Outlook: Dash Price Prediction
According to
CoinGabbar analysis, the Dash price prediction stays bearish while DASH trades below the $44.28 resistance level. The RSI reads 32.66, the 50-day EMA sits 25.6% overhead, and 98% of 24-hour liquidations hit longs.
A first test of $37.47 looks likelier than a push to the 50EMA, since buyers haven't reclaimed a single resistance level yet.
The condition to monitor is the daily candle against $37.47. A candle trading below it opens at $32.72, while a bounce that holds above it keeps the price inside the base range until $44.28 gets tested.
Disclaimer: This article is for information only and isn't financial advice. Traders should do their own research and risk only what they can afford to lose.