
Markets8 min read
Inflation Never Really Left. Markets Just Stopped Looking.
For months, investors convinced themselves that inflation was defeated. Oil, geopolitics, and central banks are now reminding markets that the story may be far from over.
Key Takeaways Stablecoin dominance nearly doubled, rising from 7.6% to about 15% since September 2025. The shift is a denominator effect: the market cap halved while stablecoin supply grew ju

According to CryptoRank.io, the rise is less a story of money flooding into stablecoins than of everything around them shrinking. The on-chain data, drawn from CryptoQuant’s stablecoin flow metrics, confirms it: usage has held steady while the rest of the market contracted. Yet beneath that flat-looking number sits a more interesting structural shift worth unpacking in full.
The framing of a doubling is technically accurate but easy to misread. Since crypto’s total market capitalization peaked in September 2025, it has fallen roughly 50%, from $4.21 trillion to about $2.10 trillion at the begging of June 2026.
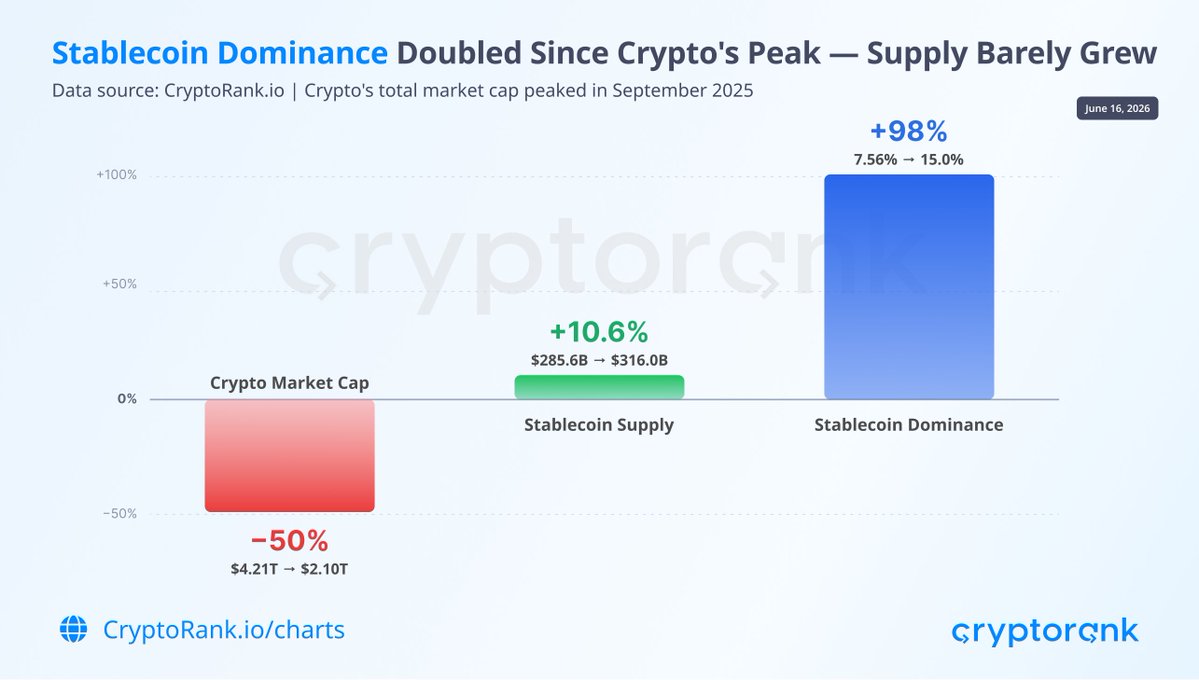
Over the same nine months, stablecoin supply grew only 10.6%, from $286 billion to $316 billion, an increase of about $30.4 billion. Because dominance is simply stablecoins as a share of the whole, a near-flat numerator against a halved denominator produces a jump in the ratio from 7.6% to roughly 15%, a 98% rise in the percentage that has little to do with new stablecoin demand.
This is what analysts call a denominator effect, and naming it is the difference between reporting the number and understanding it. Stablecoin dominance rising during a downturn is largely mechanical: as volatile assets lose value, the dollar-pegged slice of the market automatically grows in relative terms even if no new capital arrives. Picture a room where one person stays the same weight while everyone else loses half of theirs; that person now accounts for a far larger share of the room’s total mass without having gained an ounce. The 10.6% supply growth is the figure that actually measures fresh stablecoin issuance, and it is modest.
A single metric can mislead, so the more reliable read comes from cross-referencing several. CryptoQuant’s data on ERC-20 stablecoins offers exactly that, and the picture it paints is one of stable activity rather than a panic surge.
Active addresses tell the first part. Stablecoin active addresses have trended steadily higher over the past year, sitting around 521,000 recently, up from the 200,000 to 250,000 range a year ago.
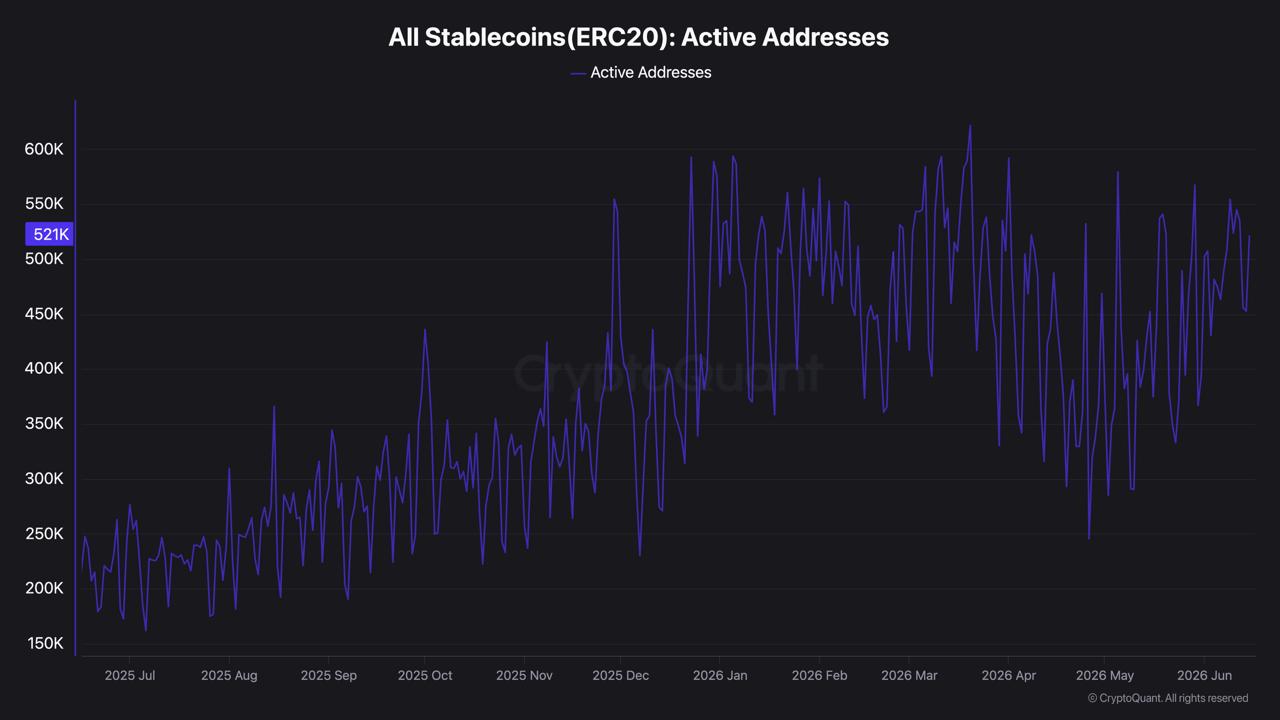
That is organic growth in usage, consistent with stablecoins becoming everyday settlement rails, not a sudden risk-off spike. If the dominance jump were driven by mass flight into stablecoins, this line would show a sharp recent surge; instead it shows a gradual climb that began long before the market topped.
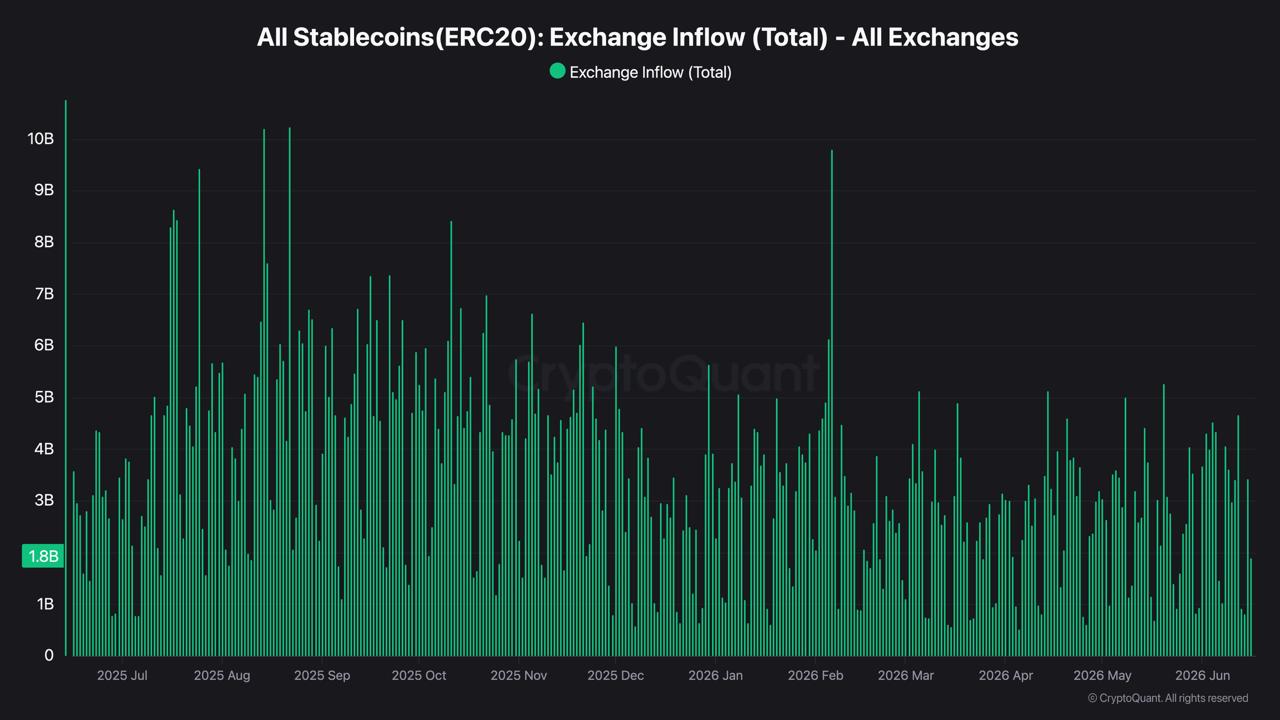
Exchange flows add the confirming layer. Stablecoin exchange inflows and outflows have moved in rough balance, with net flows oscillating around zero rather than showing sustained one-directional pressure; the most recent net reading near a positive $567 million is well within normal daily noise.
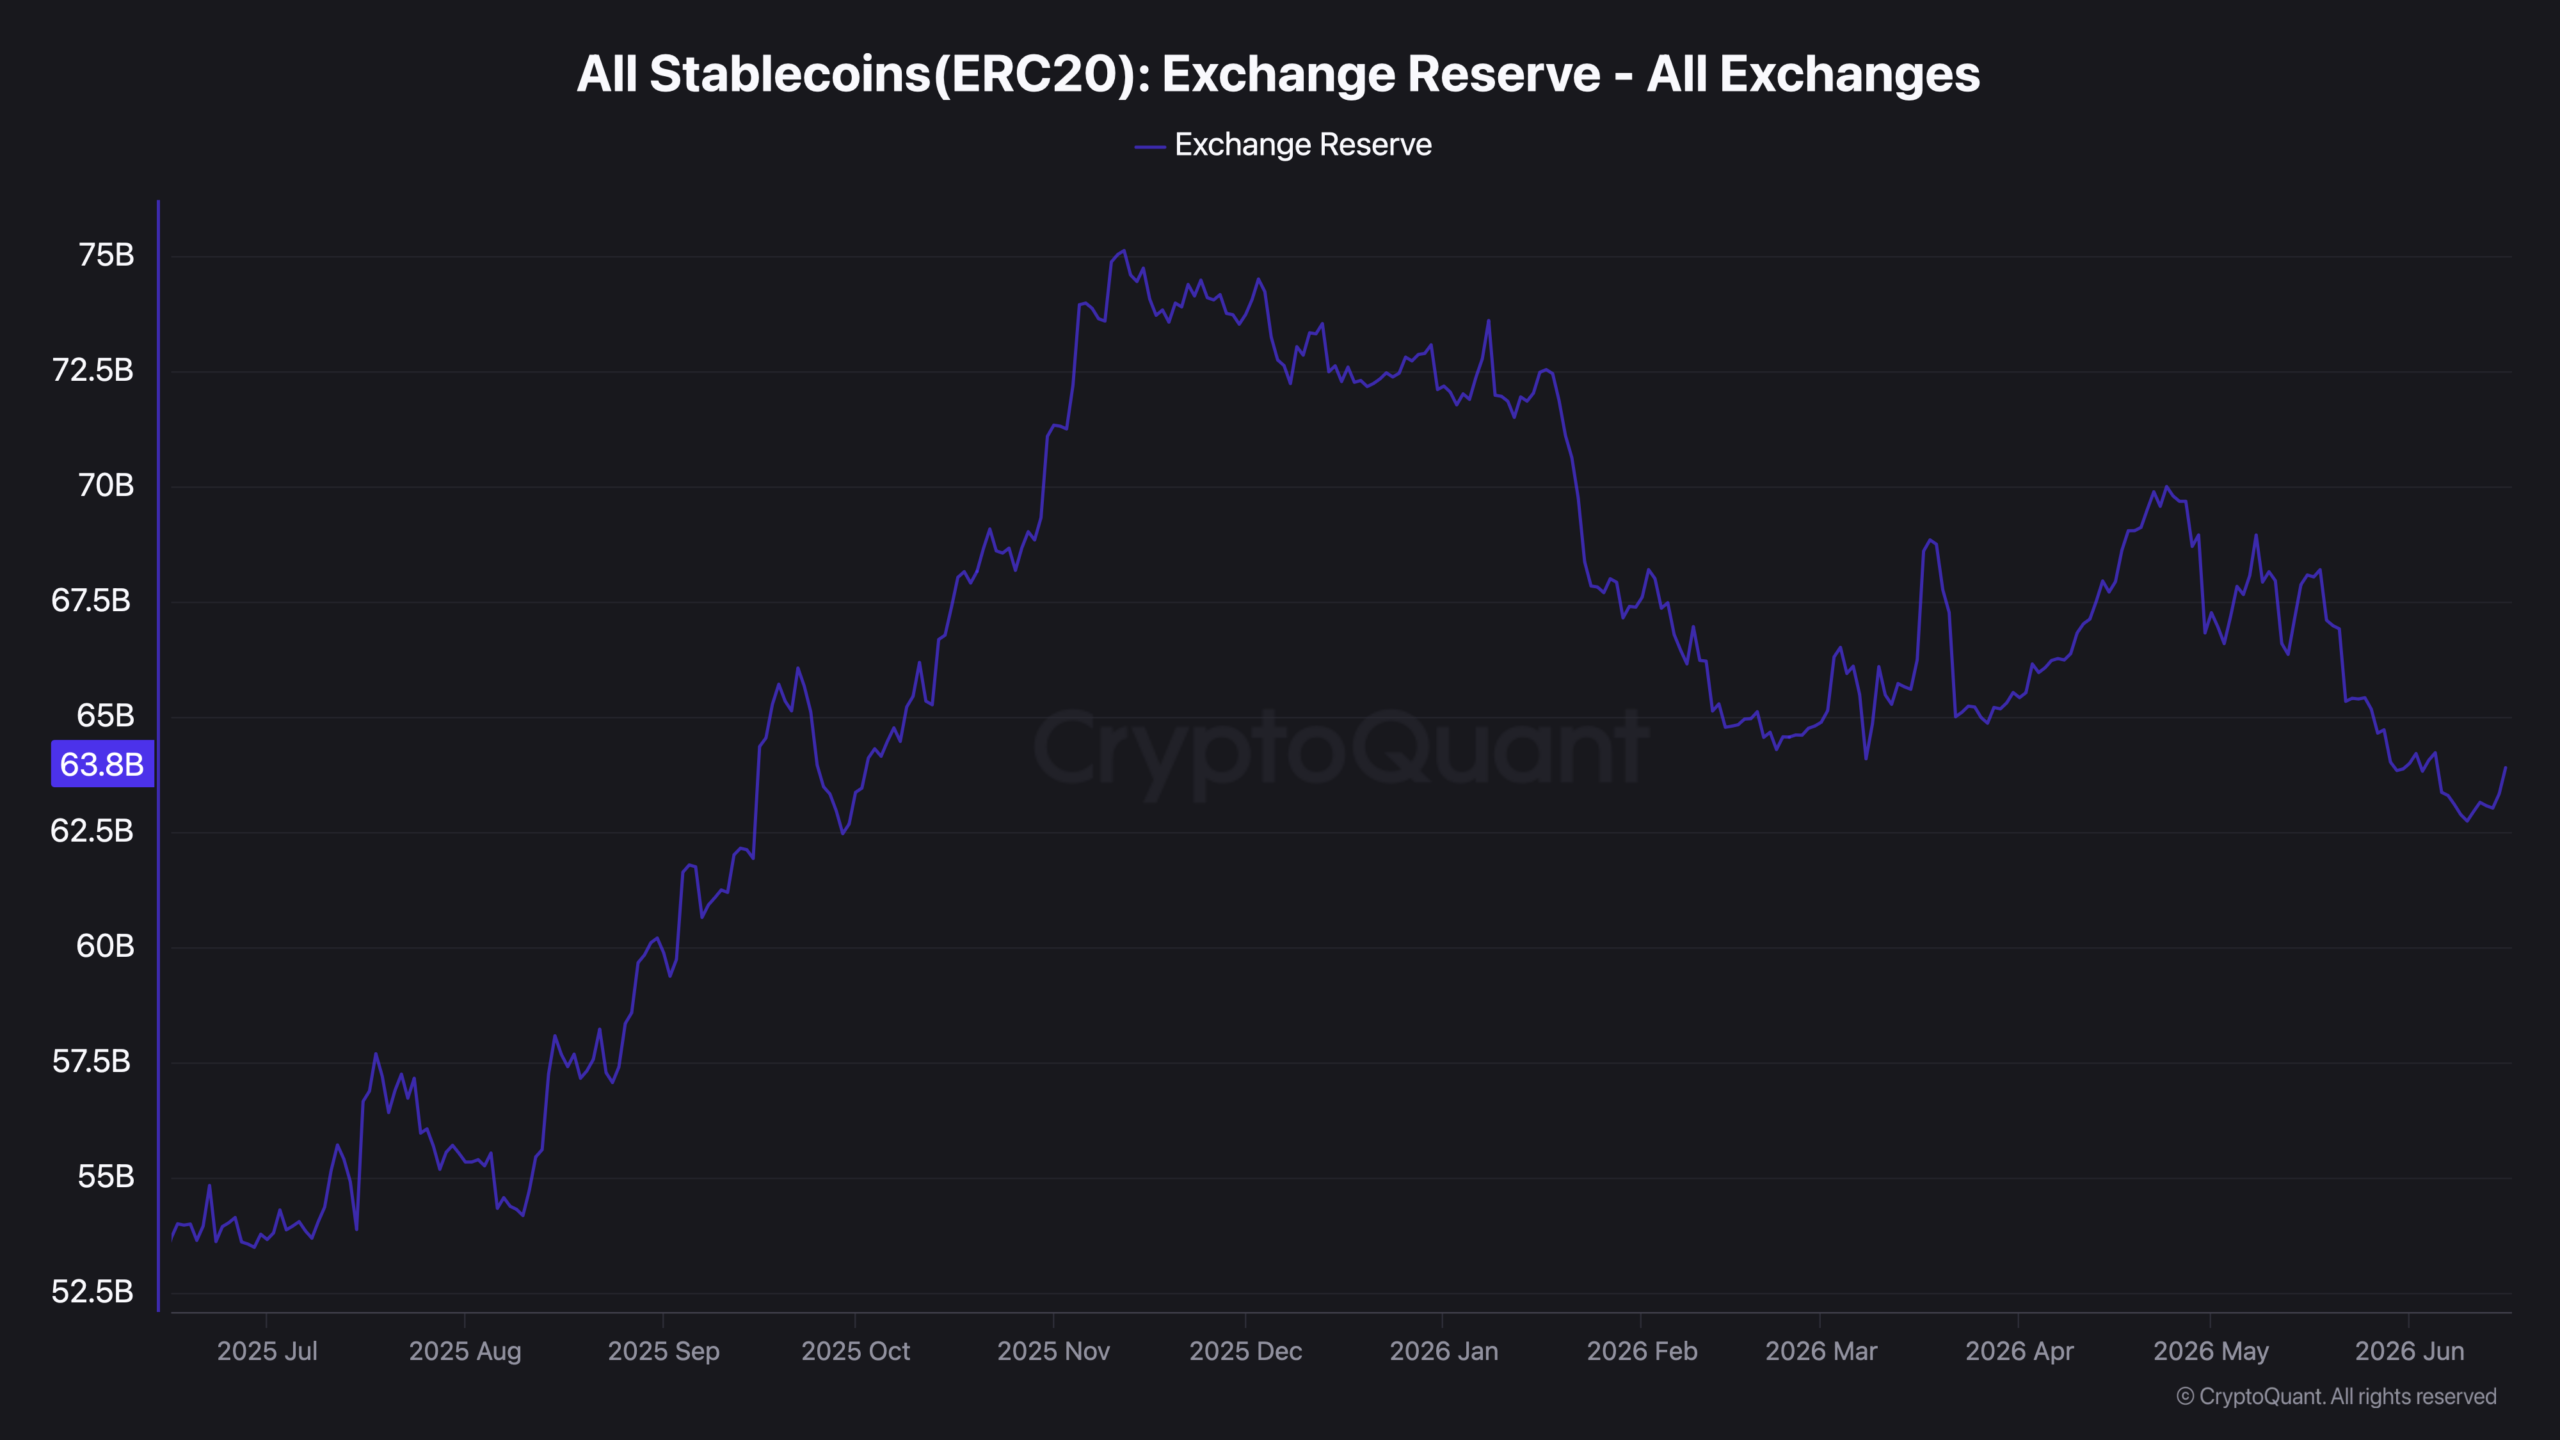
Crucially, the exchange reserve, the total stablecoin sitting on exchanges ready to buy, stands near $63.8 billion, below its late-2025 peak above $75 billion. If investors were parking large new sums in stablecoins as dry powder, that reserve would be climbing; instead it has drifted lower, and the exchange supply ratio has eased to around 0.41 from higher levels.
Three independent metrics, addresses, flows, and reserves, point the same way, which is what makes the conclusion sturdy rather than speculative.
Putting those readings together separates the signal from the story. The rise in stablecoin dominance is a real structural fact, but it reflects the broader market’s contraction, not a wave of capital rushing to the sidelines. Steady active addresses point to genuine, growing utility; balanced exchange flows and a declining reserve argue against a fear-driven hoarding of dollars on exchanges. In other words, the dominance chart is measuring weakness elsewhere, not strength in stablecoins.
That distinction matters for what comes next. A dominance spike caused by panic accumulation would suggest a large pool of sidelined capital waiting to re-enter risk assets, a potential fuel source for a rally. The data here suggests something quieter: stablecoins are growing into a settlement and payments role at a measured pace, while their headline dominance is inflated by the very market decline that has defined 2026. The takeaway is to treat the “doubling” as a symptom of the downturn rather than a leading indicator of the next move.
Here is where the modest 10.6% figure becomes misleading in the other direction. A flat supply line suggests stagnation, but it masks a change in what stablecoins are being used for. Through 2024 and early 2025, stablecoin growth was largely a function of speculation: supply expanded when traders wanted leverage and dry powder. In 2026, the composition of demand has shifted toward payments and settlement, a use case that does not necessarily inflate total supply but does deepen the asset class’s role in the financial system.
The evidence is in the infrastructure being built around stablecoins rather than in the supply chart. Visa launched USDC settlement in the United States in December 2025, letting issuers and acquirers settle on-chain with near-instant finality. Stripe, Mastercard, PayPal, and Western Union have all launched or piloted stablecoin settlement programs, treating them as infrastructure upgrades rather than experiments. In international B2B payments, USDT and USDC are increasingly used to bypass the multi-day delays and layered fees of traditional correspondent banking, settling cross-border transfers in minutes. Stablecoins accounted for roughly 75% of total crypto trading volume in the first quarter of 2026, and on a transaction-volume basis the asset class already rivals established card networks. None of that requires supply to balloon; it requires the same dollars to circulate faster and for more purposes.
The regulatory backdrop reinforces the shift from speculative float to financial plumbing. The GENIUS Act, passed in 2025, brought dollar stablecoins under a framework requiring full reserves and regular audits, with implementation rules due to take effect in mid-2026. That moves stablecoins from a lightly regulated product toward something closer to a licensed, audited instrument comparable to a money-market fund, and it opens the door for banks and traditional financial institutions to act as custodians or issue their own.
This matters for interpreting the dominance data because it changes who holds stablecoins and why. A market where stablecoins are primarily trader dry powder behaves differently from one where they are settlement instruments held by businesses and institutions. The former empties quickly into risk assets when sentiment turns; the latter is stickier, held for operational reasons regardless of crypto’s price. The slow, steady active-address growth in the on-chain data is consistent with this second, more durable kind of demand taking a larger share over time.
For anyone using stablecoin dominance as a market signal, the practical lesson is to always check it against supply. Dominance rising alongside flat or shrinking supply is a denominator effect and says more about falling prices elsewhere than about stablecoin demand. Dominance rising alongside genuinely expanding supply and climbing exchange reserves would be the bullish version, real dry powder accumulating for redeployment. The two look identical on a dominance chart and mean opposite things, which is precisely why the single metric is so often misread.
The signals worth watching are concrete. A sustained climb in the exchange reserve back toward its prior highs would indicate genuine dry powder building, the bullish reading of rising dominance. A sharp jump in active addresses beyond the current trend would signal accelerating real-world usage. And a meaningful expansion in total supply, well above the modest 10.6% seen so far, would be the first sign that new capital, rather than a shrinking market, is driving stablecoin growth. Until one of those shifts, the most accurate reading is also the simplest: stablecoins held steady while everything else fell, even as their role beneath the surface kept getting larger.
This article is for informational purposes only and does not constitute financial advice. Consult a professional before making investment decisions.The post Decoding Stablecoin Dominance: Data vs. Market Hype appeared first on Coindoo.