$DEXE is one of the biggest movers in the market this week after crashing roughly 97 percent from an all-time high near $49 down to about $1.60 in under 3 days, following a sharp short squeez
$DEXE is one of the biggest movers in the market this week after crashing roughly 97 percent from an all-time high near $49 down to about $1.60 in under 3 days, following a sharp short squeeze that pushed the token to that peak in the first place.
DeXe Network builds tools for social and copy trading along with DAO Studio, a no-code way to launch and run a DAO with AI-assisted treasury and voting features.
This DeXe Price Prediction looks at what the chart and liquidation data say about where the price goes from here. Keep reading to see how the levels stack up.
DEXE price today: Market Overview
Metric
Value
Price
$2.3171
24h Change
-34.7%
24h Range
$1.57 - $3.92
Market Cap
$221.03M
Fully Diluted Valuation
$221.03M
24h Trading Volume
$210.165M
Circulating Supply
96.505M $DEXE
Total Supply
96.505M $DEXE
Source: Data from CoinGecko as of 24/07/2026. Figures may vary slightly across other tracking websites.
Liquidation and Volume Data
Liquidations show a mixed picture by timeframe. Over the last hour and 4 hours, shorts took the bigger hit ($142.62K of $148.89K in 1h and $314.57K of $409.75K in 4h), suggesting a recent squeeze on short sellers.
But over 12h and 24h, the balance flips toward longs, with $2.41M in long liquidations against $1.88M in shorts over 24 hours, reflecting the broader crash from $49. 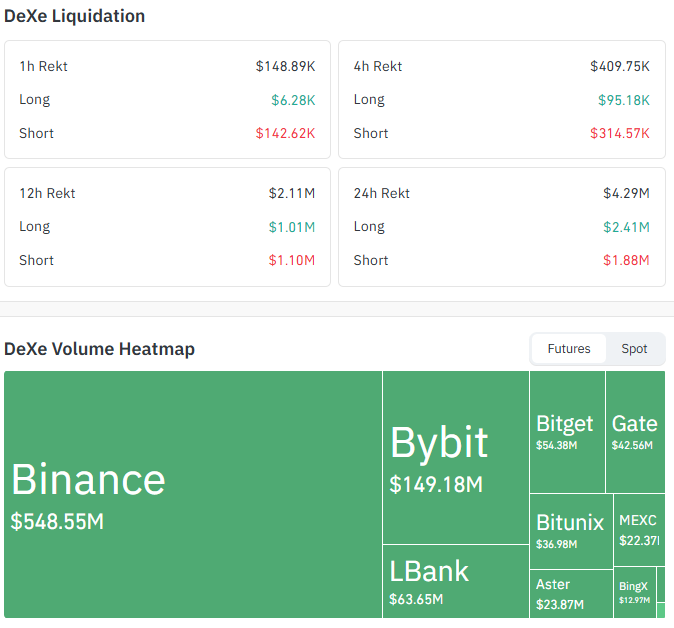
Source: Data From CoinGlass
Futures volume is dominated by Binance at $548.55M, well ahead of Bybit at $149.18M and LBank at $63.65M, pointing to this move playing out mainly on leverage at the largest venue.
DEXE news today: Why Is DEXE Price Moving
DEXE's move traces back to a listing catalyst around July 9 that sparked a rally, followed by a short squeeze between July 10 and 13 as traders betting against the token were forced to buy back, pushing the price to an all-time high near $49 on July 13.
Since then, the token has given back nearly all of that gain.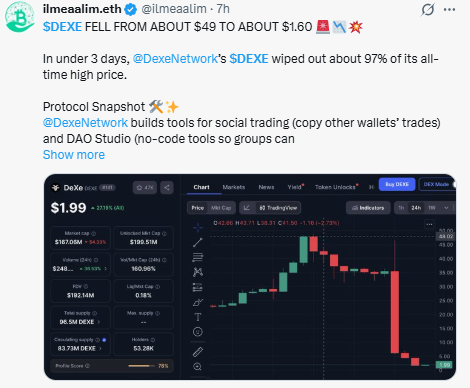
Separately, social media posts have circulated claiming large $DEXE amounts moved from team-linked wallets toward Binance, with some framing this as a team dump and others alleging it involves stolen tokens from a compromised wallet.
Neither claim has been confirmed by DeXe Network or verified independently, and there is no confirmed hack or smart contract breach at this time.
These should be treated as unverified allegations from social media, not confirmed facts, until DeXe Network issues an official statement.
DEXE price forecast: Chart Analysis
DEXE has been in a steep downtrend since its peak, tracked by a single descending trendline running from the all-time high down to the current price.
After an initial sharp fall, price consolidated sideways between roughly $4.3908 and a higher band $0.0516 (50 ema), then broke down out of that range, clearing the $3.8111 level and continuing to fall until finding a floor near $1.9200, where it is now attempting to base and press back up against the descending trend line; if it breaks, then a sharp up move is possible.
The EMA readings (20: 2.3529, 50: 5.0516, 100: 11.4547, and 200: 19.6224) confirm the price is trading well below every major EMA, with the EMAs together in a steep bearish order, consistent with an active downtrend. 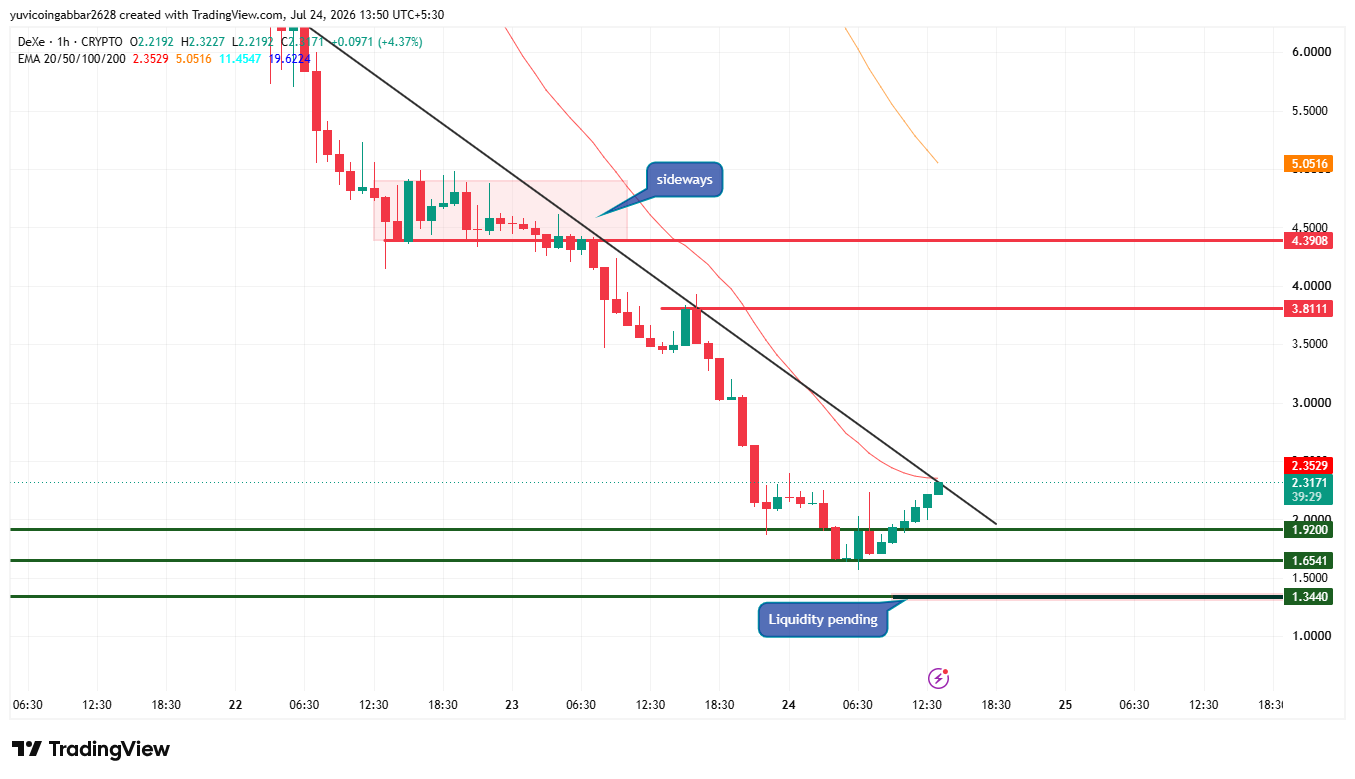
The descending trendline is the immediate level of price needed to clear for any real shift in structure.
Level
Price
Type
Resistance
$4.3908
Former sideways range top
Resistance
$3.8111
Breakdown level from the sideways range
Immediate price reference
$2.3171
Current price, testing descending trendline from below
First support
$1.9200
Recent basing zone
support
$1.6541
Next level down if $1.92 fails
Support and Liquidity pending
$1.3440
Deeper liquidity zone below current structure
Price Scenarios
Scenario
Target
Trigger
Timeframe
Invalidation Level
Bullish
$3.8111
Break and hold above the descending trendline and $1.92 support with rising volume
3 to 7 days
Close back below $1.9200
Base Case
$1.9200 to $3.8111
Price consolidates without a clear trendline break
3 to 7 days
Daily close outside either side of the range
Bearish
$1.3440
Break below $1.9200 with continued long liquidations
3 to 7 days
Reclaim of $1.9200 on rising volume
Two Scenarios: Bounce vs Breakdown
Bounce scenario: If DEXE clears the descending trendline and holds above $1.9200 on rising volume, the next test becomes the $3.8111 breakdown level, followed by $4.3908 if momentum continues. Invalidation for this view is a daily close back below $1.9200.
Breakdown scenario: If $1.9200 fails to hold, DEXE risks sliding toward the $1.6541 level first, with the $1.3440 liquidity zone as the deeper target if selling continues. Invalidation for this view is a reclaim of $1.9200 on rising volume.
Risk Note
DEXE remains highly volatile after an approximately 97 percent drawdown from its recent all-time high, driven initially by a short squeeze rather than organic demand.
Unverified social media claims about wallet movements add further uncertainty. Until DeXe Network addresses these claims directly, treat any related headlines with caution and avoid combining them with confirmed price data.
DeXe technical analysis: Expert View
The chart and liquidation data point to a market still working through the aftermath of a short-squeeze-driven spike and crash rather than a confirmed hack or team dump.
The recent short-side liquidations in the 1h and 4h windows suggest some near-term relief, but the price remains well below every major EMA in a clear downtrend.
A genuine reversal would need a hold above the descending trendline and the $1.9200 support, ideally alongside an official response from DeXe Network on the wallet movement claims.
Disclaimer: This article is for informational purposes only and should not be considered financial or investment advice. Cryptocurrency markets are highly volatile, and prices can change rapidly based on market conditions. Readers should conduct their own research and consult a qualified financial advisor before making any investment decisions. CoinGabbar does not guarantee the accuracy of price predictions, and past performance is not indicative of future results.