DEXE is one of the top movers today, and traders are watching closely to see if this rally has more room to run. The coin bounced off a clean Demand Zone earlier this week, and short sellers
DEXE is one of the top movers today, and traders are watching closely to see if this rally has more room to run.
The coin bounced off a clean Demand Zone earlier this week, and short sellers are getting caught out along the way. DEXE is currently trading at $3.3924, up 24.38% in the last 24 hours.
This DeXe Price Prediction breaks down the on-chain data, the liquidation numbers driving this move, and the key chart levels that will decide what happens next.
DeXe describes itself as a decentralized asset management and DAO infrastructure protocol, according to the project's own materials. Stick around till the end; this one's worth it.
DEXE Price Today: Market Overview
Metric
Value
Price (DEXE/USD)
$3.3924
24h Change
+24.38%
Market Cap
$282.23M (+24.38%)
Unlocked Market Cap
$337.06M
24h Trading Volume
$333.8M (+9.45%)
Volume / Market Cap (24h)
118.77%
Liquidation / Market Cap
0.14%
Fully Diluted Valuation
$325.28M
Total Supply
96.5M DEXE
Max Supply
No max supply
Circulating Supply
83.73M $DEXE
Holders
54.58K
Source:Data from CoinMarketCap as of July 28, 2026. Figures may vary slightly across other tracking websites.
DeXe Liquidation and Volume Data
Liquidations lean heavily toward shorts across every timeframe. Over 24 hours, $767.12K in short positions got liquidated compared to $587.70K in longs, and the same pattern holds on the 1h, 4h, and 12h windows.
This is a textbook short squeeze, where forced short covering adds extra fuel on top of organic buying.
Volume is also running hot, with 24h trading volume of $333.8M against a market cap of just $282.23M, a ratio of 118.77%. 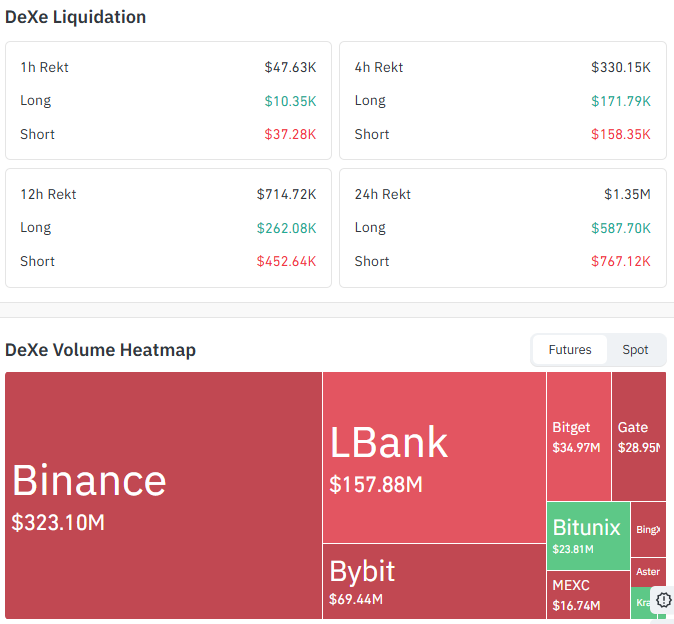
Source: Data From CoinGlasss
Binance alone accounts for over $323M of futures volume, with LBank and Bybit also contributing meaningfully.
For investors, this combination signals that a large part of the move is leverage-driven, which can push price further and faster than fundamentals alone but also makes a sharp reversal more likely if sentiment turns. 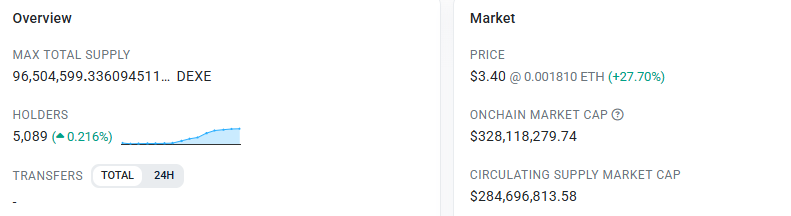
As per the EtherScan data, on the tokenomics side, all 100 million $DEXE across DAO Treasury, Foundation, Team, Staking Rewards, and Token Sale allocations are already 100% unlocked, with nothing locked or untracked.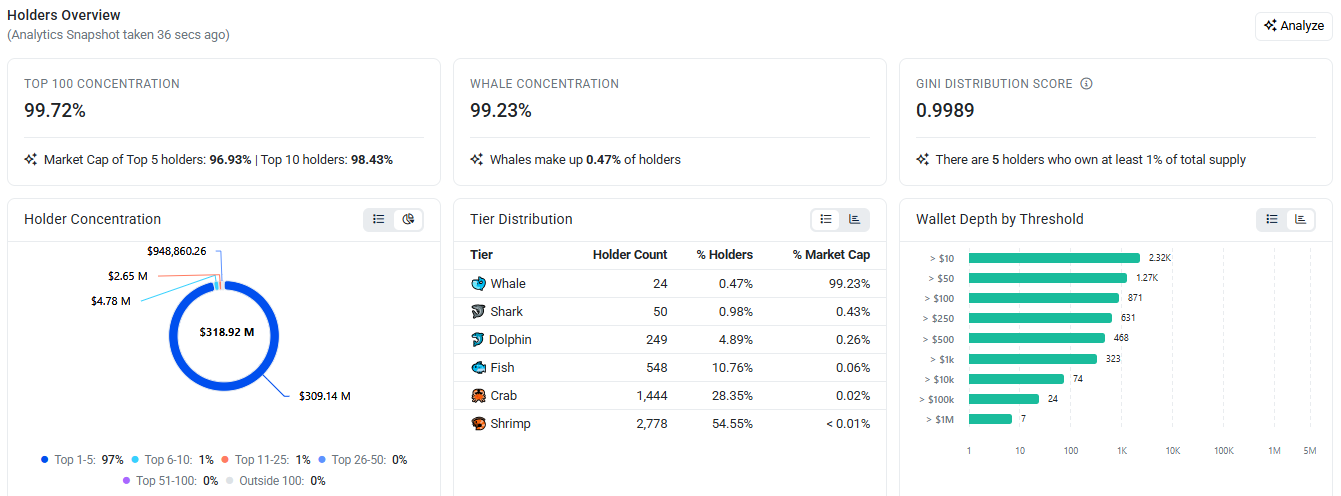
That removes a common reason rallies fail, since there is no scheduled unlock event waiting to add fresh sell pressure.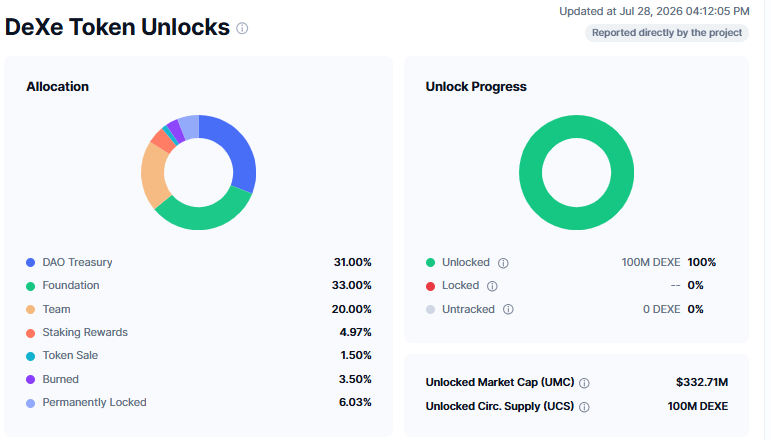
The top 100 wallets do hold 99.72% of the supply, with just 5 wallets controlling over 96% of the market cap, so large wallet activity can still move price sharply in either direction.
DEXE forecast 2026: DEXE Chart Analysis
$DEXE reversed form a Demand Zone near $1.675 to $2.4309 around July 24, then rallied hard into July 25 and 26, spiking to $6.4109 before pulling back sharply, a normal move after a fast, emotional rally.
Price has since consolidated and is pushing higher again, last trading at $3.3924, up on the session.
This DEXE technical analysis breaks down the levels that matter from here.
Price is now trading above the EMA cluster, with the shorter EMA near $3.2006 and the longer EMA near $3.0386, which acts as dynamic support. 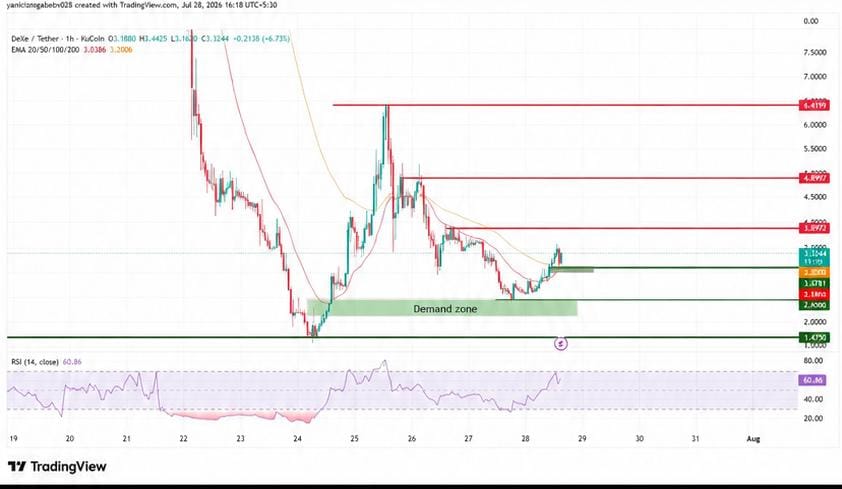
RSI (14) sits at 60.86, bullish and rising but not yet overbought, leaving room for further upside before momentum looks stretched.
Level
Price
Type
Prior spike high
$6.4109
Ultimate resistance if momentum extends
Upper resistance
$4.9097
Secondary target above immediate resistance
Immediate resistance
$3.8992
First level to clear to confirm continuation
Current price
$3.3924
Trading above the EMA cluster
EMA support zone
$3.0386 to $3.2006
Dynamic support, first line of defense
Support
$2.43
Demand Zone base
Deeper support
$1.6756
Structural low, final line in the sand
The EMA 20/50 cluster is the level to watch most closely. As long as $DEXE holds above $3.04, the short-term structure stays bullish, and the Demand Zone breakout remains intact.
DeXe Price Prediction: Price Scenarios
Scenario
Target
Probability
Trigger
Timeframe
Bullish
$4.9097
30%
Clean break and hold above $3.8992 on rising volume, continued short covering
0 to 7 days
Base Case
$3.0386 to $3.8992
50%
Price consolidates around the EMA cluster without a decisive break either way
0 to 7 days
Bearish
$2.43
20%
Loss of the EMA cluster, Demand Zone breakdown, longs get squeezed instead
0 to 7 days
Probability weighting reflects that the Demand Zone breakout is still fresh and being driven partly by short covering, favoring consolidation over an immediate extension or full reversal.
Two Scenarios to Watch
Recovery Scenario: If $DEXE holds above the EMA cluster and clears $3.8992 on rising volume, the path opens toward $4.9097 and eventually the $6.4109 spike high further out. This scenario is invalidated by a close back below $3.0386.
Breakdown Scenario: If price fails to hold the EMA cluster and slips below $3.0386, the Demand Zone breakout weakens, opening a slide toward the $2.43 base and potentially the $1.6756 structural low.
This scenario is invalidated by a reclaim of the EMA cluster on rising volume.
See our DeXe price history for how the token has behaved after similar pullbacks.
Risk Note
A large share of today's move is being driven by leveraged short covering rather than spot buying alone, which means volatility is likely to stay elevated in both directions.
Holder concentration remains high, with just 5 wallets controlling over 96% of market cap, so large wallet activity can move price sharply.
Treat this rally as strong short-term momentum rather than a confirmed trend reversal until the price clears resistance on sustained spot volume.
DeXe Expert View
According to CoinGabbar analysts, the combination of a fully unlocked token supply and heavy short liquidations gives this Demand Zone breakout real short-term credibility, but the high concentration among top wallets means the move could reverse quickly if large holders decide to take profit.
Whether $DEXE can build on this rally will likely come down to whether buyers can push and hold the price above $3.8992 in the coming days. For more on how DeXe's DAO infrastructure works, see our DeXe project overview
Disclaimer
This article is for informational purposes only and should not be considered financial or investment advice. Cryptocurrency markets are highly volatile, and prices can change rapidly based on market conditions. Readers should conduct their own research and consult a qualified financial advisor before making any investment decisions. CoinGabbar does not guarantee the accuracy of price predictions, and past performance is not indicative of future results.