A 61% move in a day tends to make people forget their own trading rules. That is roughly what happened with this AMM token this week, and the chart now sits somewhere between "breakout" and "
A 61% move in a day tends to make people forget their own trading rules. That is roughly what happened with this AMM token this week, and the chart now sits somewhere between "breakout" and "blow-off top," depending on who you ask. We pulled the daily and weekly charts, the on-chain holder data, and the derivatives numbers to see which side actually has evidence behind it.
Why This DeFi Token Suddenly Woke Up
DODO price prediction conversations went quiet for months. Then the chart moved, and everyone remembered the ticker existed.
Here is the thing about sleepy charts. They tend to snap hard once they finally move, and that is exactly what traders are debating right now.
Similar moves have shown up before. A recentDODO whale breakout analysis flagged accumulation weeks before this rally started.
But a sharp green candle alone does not tell you whether this is early-stage accumulation or a crowded trade about to exhale. And that difference matters a lot if you are deciding whether to chase it.
This piece is not another recap of the same breakout headline you have already seen twice this week. It walks through the daily structure, the weekly structure, who actually holds the supply, and where leverage traders are positioned.
So where does that leave the setup heading into the next few weeks?
Key Takeaways
DODO traded near $0.0301, up sharply on 24-hour volume of $85.5M.
Daily RSI sits at 72.31, inside overbought territory; weekly RSI is calmer at 64.01.
Both daily and weekly structures show an ascending channel, with daily resistance near $0.0336 and $0.0410.
Whale wallets control 89.04% of supply across just 17 addresses.
Liquidity relative to market cap is thin at 0.47%, meaning price can swing fast on both sides.
Daily Chart Analysis: DODO/USDT
The daily candle opened at $0.02696 and closed at $0.02996, a session gain of 11.29%, while the rolling 24-hour figure shows a steeper 61.41% move to $0.03013.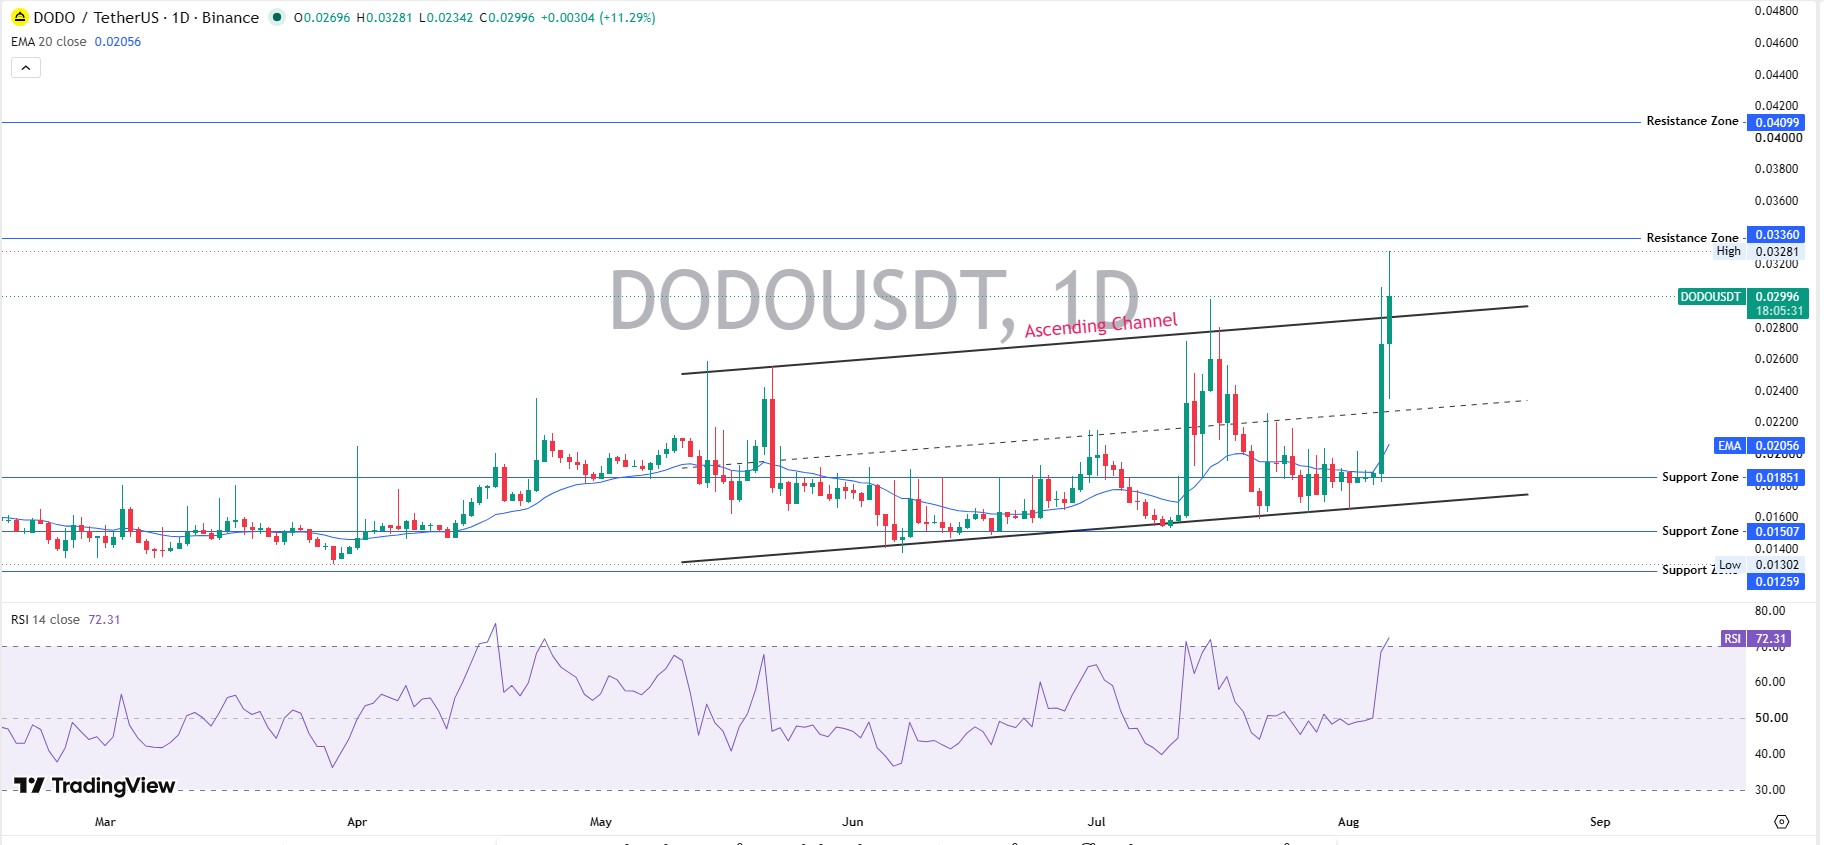
Turns out both numbers can be true at once. One measures the single candle; the other measures a full rolling day that caught more of the spike.
Price is trading well above its 20-day EMA of $0.02056. That gap alone tells you this run is extended, not gentle.
RSI-14 on the daily reads 72.31. Above 70 usually means buyers are getting tired, not that they are finished.
The structure itself is a clean ascending channel, visible on alive TradingView chart, stretching back to March. Higher lows have held every time the price tested the lower rail.
Immediate resistance sits at $0.0336, matching the recent high of $0.0328. Above that, $0.0410 is the next real wall, a level worth watching alongside any upcoming project catalysts on thecrypto events calendar.
On the downside, support layers sit at $0.0185 and $0.0151, with a deeper floor near $0.0130. A close under $0.0185 would be the first real crack in this leg.
Weekly Chart Analysis: DODO/USDT
Zoom out and the trend holds up. The weekly candle trades at $0.02994 versus $0.01843, a 62.45% weekly gain, riding the same ascending channel visible on the daily.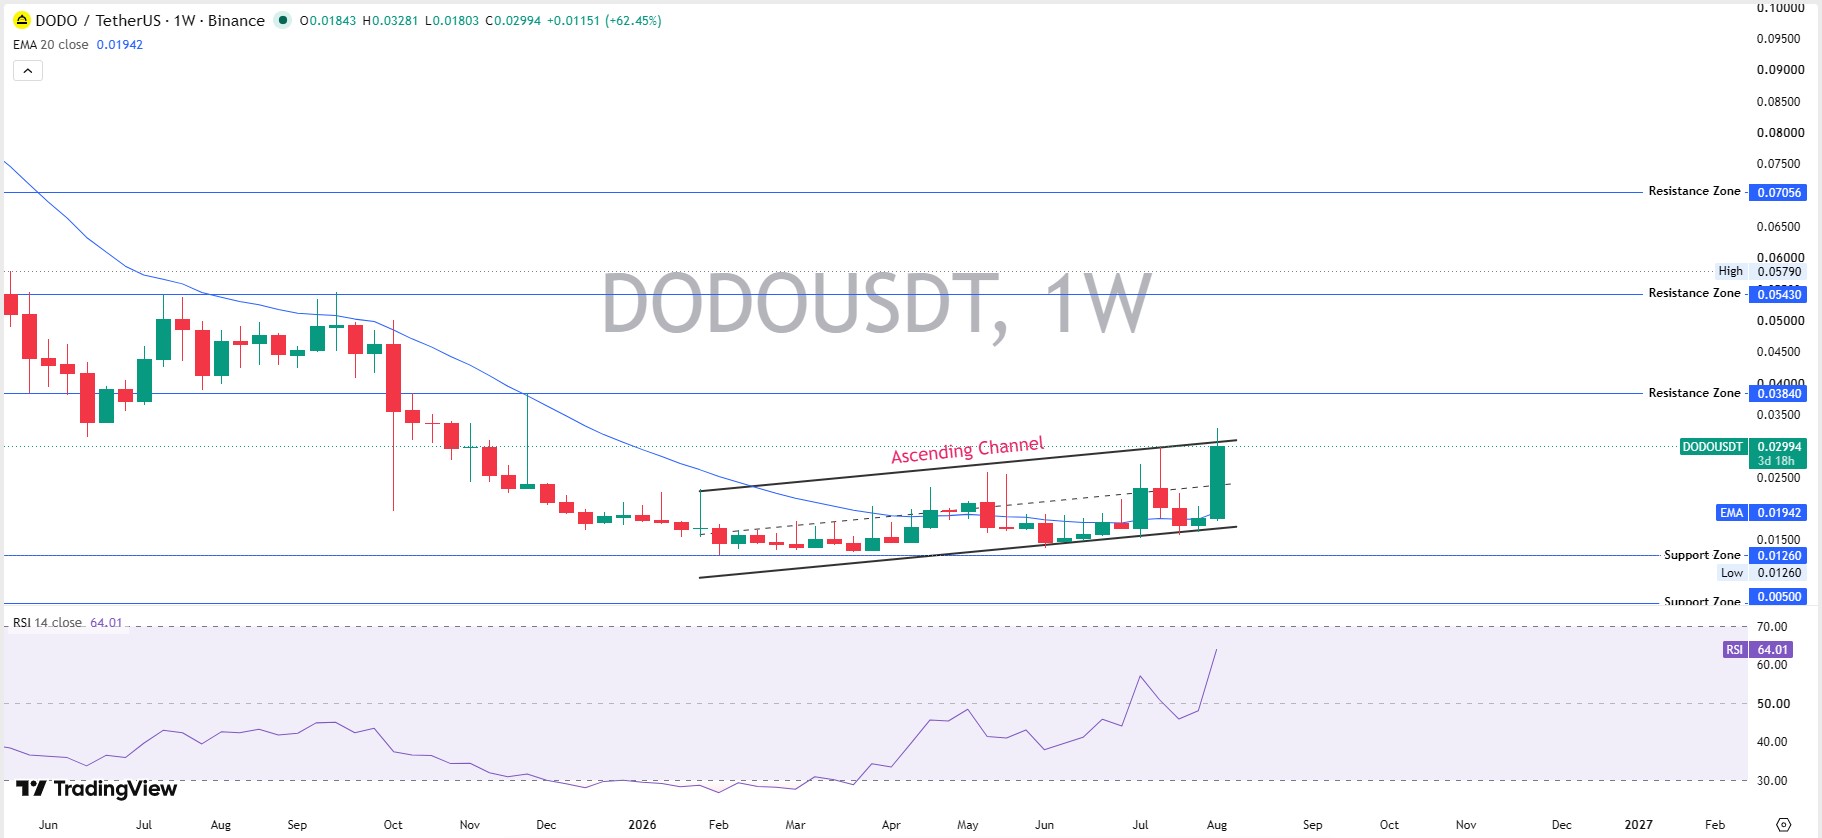
Weekly RSI reads 64.01, elevated but not extreme, while price sits nearly 54% above its $0.01942 EMA-20.
Resistance stacks up at $0.0384, $0.0543, and $0.0706. Readers comparing setups across the sector can browse the wideraltcoin price prediction hub for similar channel patterns.
Support sits far below at $0.0126, with a wider zone near $0.0050, leaving little resting volume underneath.
Worth remembering: the all-time high was $8.51 back in February 2021, still 99.65% away, per currentDODO market data. The all-time low of $0.01283 was hit just six months ago, in February 2026. The current price sits 131.88% above that low.
DODO Tokenomics and Whale Concentration: What the On-Chain Data Shows
Supply mechanics here are simple on paper. Total, max, and circulating supply are all 1 billion DODO, so there is no future unlock cliff hanging over the price the way there is for some newer tokens still tracked on thetoken unlock events list.
That part is clean. The holder distribution is not.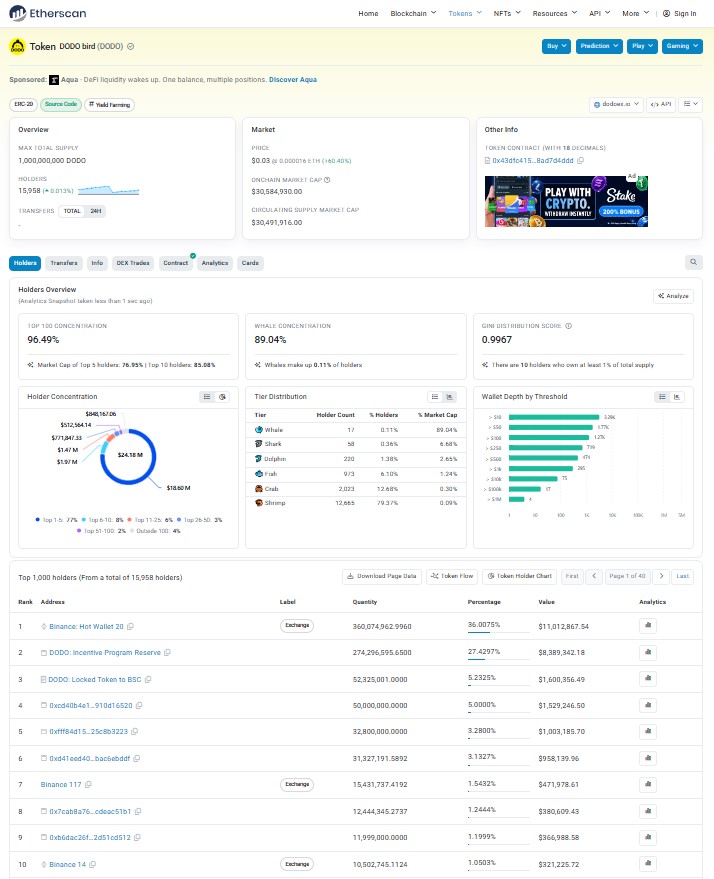
On-chain records show 15,958 holders, but the top 100 wallets control 96.49% of supply, according to Etherscan holder data. Whale wallets alone, just 17 of them, hold 89.04%.
The Gini distribution score reads 0.9967, close to maximum inequality on a 0-to-1 scale. Basically, a handful of addresses can move this market whenever they choose.
Breaking down the top holders: Binance Hot Wallet 20 holds 36.01% (exchange custody), the DODO Incentive Program Reserve holds 27.43%, and a locked BSC bridge wallet holds 5.23%. The next few individual wallets each hold between 3% and 5%.
The fully diluted valuation sits at $30.18M, almost identical to the $30.13M market cap. Since supply is fully circulating, FDV is not hiding future dilution the way it does for many newer altcoins.
DODO in the Altcoin Landscape
DODO is not a memecoin. It is a DeFi altcoin built around an automated market maker model, and that context matters for how you should read this rally.
Altcoin rallies like this one tend to move on liquidity chasing volume, not fundamentals shifting overnight. Vol/Mkt Cap sits at 251.14% for the day, an extreme reading that points to speculative churn rather than steady accumulation.
TVL on the protocol side reads $18.23M, giving a market cap/TVL ratio of 1.63. That is not deeply overvalued against its own protocol usage, which is one thing bulls can point to.
For contrast, sentiment-driven names behave differently than DeFi tokens like this one; the currenttop meme coins list shows a separate rotation happening at the same time, mostly disconnected from DODO's own move.
Derivatives and Liquidity Snapshot
Here is the breaking part. Liquidation data shows just $3.53 in long liquidations across the 1h, 4h, 12h, and 24h windows, with zero short liquidations in any of them, perCoinGlass liquidation data.
No forced short squeeze. No leveraged long flush either. Small numbers, but telling ones.
Spot volume concentrates on LBank ($8.64M) and MEXC ($8.55M) rather than tier-one venues, according to the exchange volume heatmap. That matters for liquidity depth.
Liq./Mkt. Cap sits at just 0.47%. Thin liquidity like that cuts both ways: it helped fuel today's spike, and it can just as easily amplify a reversal.
That is the derivatives side in full.
DODO Price Prediction 2026: Bull, Base, and Bear Scenarios
No forecast here is guaranteed. Treat every number below as a scenario, not a promise, and size any position around the invalidation level, not the target.
Scenario
Price Target
Timeframe
Probability
Invalidation Level
Bull
$0.0410
7-30D
35%
Daily close below $0.0251
Base
$0.022 - $0.034 range
7-30D
45%
Break of ascending channel either side
Bear
$0.0151 - $0.0185
30D
20%
Reclaim and hold above $0.0336
Longer out toward 2026, the weekly resistance ladder at $0.0384, then $0.0543, and then $0.0706 marks the realistic upside path if this channel holds through multiple higher lows. None of that happens in a straight line.
Risks That Could Break This Setup
Whale concentration is the biggest one. With 89% of supply in just 17 wallets, a single large wallet decision can outweigh weeks of retail buying.
RSI at 72 on the daily is another. Overbought readings do not force a reversal, but they do raise the odds of a cooldown before the next leg.
Thin liquidity compounds both of those risks, and it is part of why volume spikes stand out so much on venues tracked through thenew exchange listings page. A market with a 0.47% liquidity-to-market-cap ratio moves further on the same size order than a deeper market would.
Glossary
RSI (Relative Strength Index): A momentum gauge from 0 to 100; above 70 usually signals overbought and below 30 oversold.
EMA (Exponential Moving Average): A trend line that weights recent prices more heavily than older prices.
FDV (Fully Diluted Valuation): What the market cap would be if all tokens that will ever exist were circulating today.
Gini Score: A 0-to-1 measure of distribution inequality; closer to 1 means fewer wallets hold more of the supply.
Liquidity Ratio: Available trading liquidity measured against total market cap; lower ratios mean thinner markets.
Higher Low: A pattern where each price dip bottoms out above the previous dip, often used to confirm an uptrend.
Final Take on DODO Price Prediction
61% in a day gets attention. Whether it holds is a separate question entirely.
The chart structure favors continuation as long as $0.0251 holds on a closing basis. But the RSI reading, the thin liquidity, and the whale concentration all argue for caution chasing the move after the fact.
Traders tracking related setups can also follow the recentChainPilot update rally coverage for more DODO-specific context, or check theBitcoin 2026 forecast for how the wider market backdrop could shape altcoin momentum from here.
Disclaimer: This article is for informational purposes only and is not financial advice. Crypto markets are volatile; verify data independently before making decisions. Data sourced from CoinMarketCap, Etherscan, and CoinGlass as of the snapshot.