This Dogecoin Price Prediction looks at DOGE holding steady just under a level that's capped it for days. Dogecoin started out in 2013 as a joke built on the Shiba Inu meme and has since beco
This Dogecoin Price Prediction looks at DOGE holding steady just under a level that's capped it for days. Dogecoin started out in 2013 as a joke built on the Shiba Inu meme and has since become one of the most actively traded coins in the market, currently ranked #11 by market cap.
Right now, the dogecoin price today is $0.0914 and is up 2.3% on the day, moving inside a $0.08808 to $0.09143 range, with a market cap of $14.241B.
Live Market Data
Metric
Value
Price
$0.0914
Market Cap
$14.241B
Fully Diluted Valuation
$14.242B
24-Hour Trading Vol
$822.813M
Circulating Supply
155.839B
Total Supply
171.554B
Max Supply
Infinite
Source: Dogecoin market data taken from CoinGecko, as of Sep 09, 2026. Figures may vary slightly across other tracking websites.
Liquidation Snapshot
Timeframe
Total Liquidated
Longs
Shorts
1h
$99.02K
$623.22
$98.40K
4h
$119.41K
$7.32K
$112.08K
12h
$205.66K
$33.20K
$172.47K
24h
$2.11M
$1.33M
$779.65K
Source: Liquidation Data Taken From CoinGlass, As of Sept 9, 2026
Shorts have taken the bigger hit across every window here except the 24-hour figure, where longs actually pull ahead, roughly 63% of that total.
Put together, it points to a market that had leveraged sellers caught out during the recent push higher, even as an earlier stretch saw longs take their share of the pain too.
Exchange Volume
Binance still runs the show on $DOGE futures, handling $589.19M over the past 24 hours.
OKX follows at $400.43M, with Bybit a distant third at $186.14M. WhiteBIT and Bitget contribute $95.05M and $92.97M, while Gate adds $79.40M. 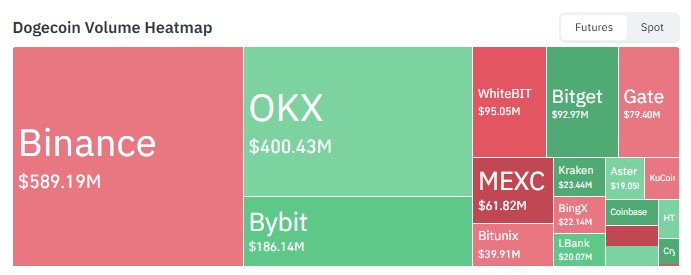
Source: Volume Heatmap Data Taken From CoinGlass, As of Sept 9, 2026.
The rest, including MEXC, Bitunix, Kraken, BingX, Aster, and LBank, fill out a fairly wide spread of smaller volumes.
Dogecoin News: What Traders Are Watching
Long-Term Sentiment Stays Constructive
Separately, the commentary account TOP $DOGE took a step back for a longer-term view, describing years of volatility and growth behind $DOGE and arguing the coin still has more ahead of it. 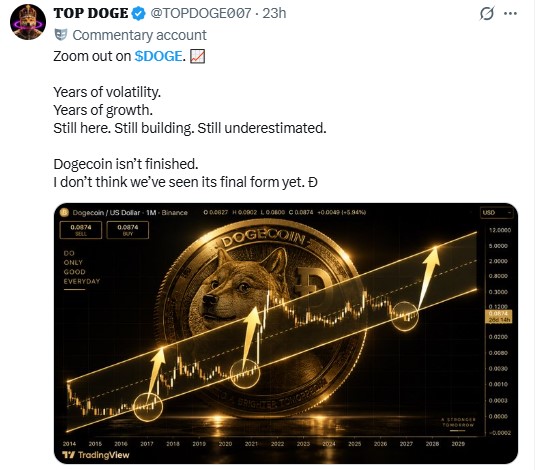
Source: Data Taken From @TOPDOGE007, X Account, as of Sep 9, 2026
It's a broad, sentiment-driven take rather than a near-term signal, but it reflects the kind of long-running community conviction that's followed DOGE through multiple market cycles.
A Cup and Handle Takes Shape
Trader Trader Tardigrade pointed to a potential cup and handle structure forming on $DOGE's 12-hour chart, with the rounded cup reflecting accumulation and a tight handle showing controlled
consolidation as volatility contracts near the pattern's top.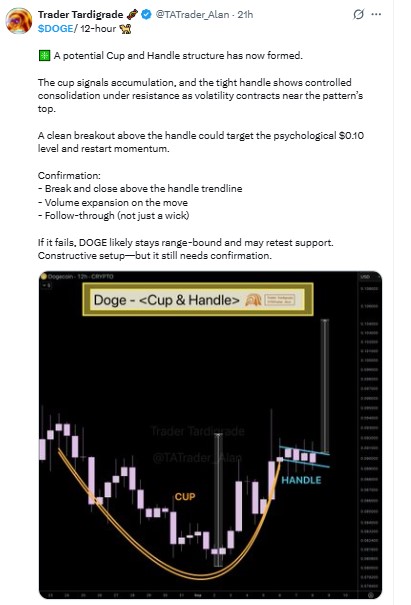
Source: Data Taken From @TATrader_Alan, X Account, as of Sep 9, 2026
According to the post, a clean breakout above the handle could target the psychological $0.10 level and restart momentum, but confirmation requires a break and close above the handle's trendline along with real volume expansion, not just a brief wick.
If that fails to happen, the post noted DOGE would likely stay range-bound and could retest support instead.
Dogecoin Price Prediction 2026: Technical Outlook
On the 4-hour DOGE/USDT chart on Binance, the price is holding above a rising trendline while consolidating inside a tight range just under resistance. 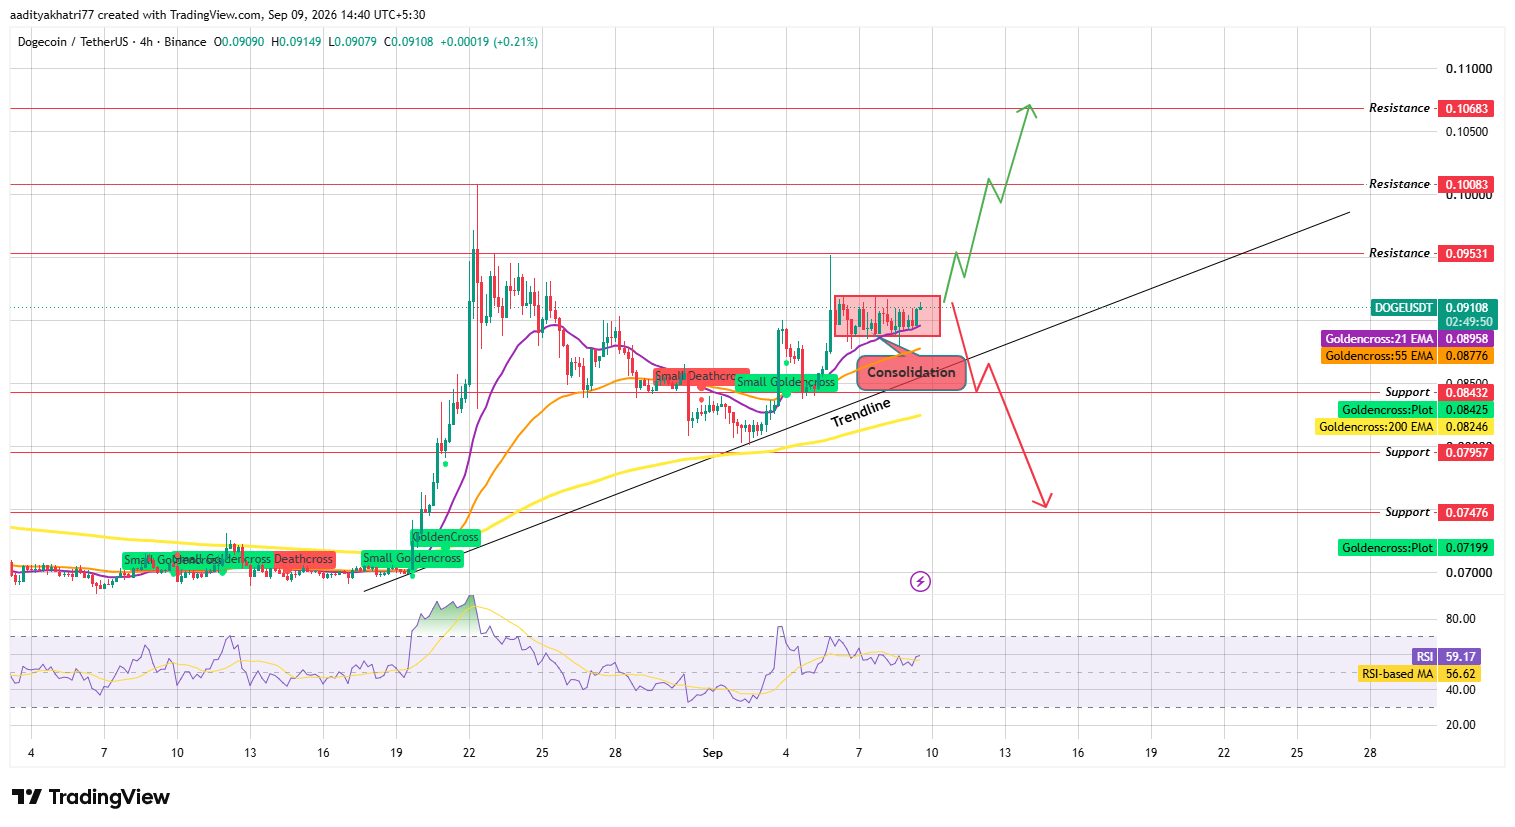
Source: Chart Taken From TradingView, as of Sep 9, 2026
RSI sits at 59.17, above its moving average of 56.62, reflecting steady momentum that hasn't yet broken decisively in either direction.
Could $DOGE Break Toward Higher Resistance?
If $DOGE clears the top of this consolidation range with a strong 4-hour close and rising volume, the first target becomes $0.09531.
A confirmed break above that on continued volume opens the path to $0.10083, with $0.10683 as the next resistance if momentum extends further.
What Happens If $DOGE Breaks the Rising Trendline?
If instead the price breaks below both the consolidation range and the rising trendline beneath it, with volume confirming the move, $0.08432 becomes the first support to watch.
A failure to hold that could send $DOGE toward $0.07957, and continued weakness would put $0.07476 in view.
Support and Resistance Levels
Support
Resistance
$0.08432
$0.09531
$0.07957
$0.10083
$0.07476
$0.10683
EMA Levels (4-Hour)
EMA
Level
21 EMA
$0.08958
55 EMA
$0.08776
200 EMA
$0.08246
Bull, Base, and Bear Scenarios
Scenario
Setup
Level
Bull
Break above consolidation resistance on volume.
$0.09531–$0.10683
Base
Price stays range-bound in the consolidation box.
$0.089–$0.095
Bear
Break below trendline and consolidation support
$0.08432–$0.07476
Glossary
A cup and handle is a chart pattern where price rounds out a gradual U-shaped dip, the cup, before pulling back into a smaller, tighter consolidation, the handle, right under resistance, and a breakout above that handle is typically read as bullish.
A rising trendline connects a series of higher lows, and holding above it usually signals buyers remain in control, while losing it can flip that read.
RSI measures how fast and how far price has moved recently, helping traders judge whether momentum is building or fading.
Liquidation happens when an exchange force-closes a leveraged position after a trader's margin runs out, and it tends to spike around sharp moves that catch one side of the market off guard.
Support and resistance are simply the price zones where buying or selling pressure has repeatedly shown up before, strong enough to pause or reverse a move.
DOGE vs Bitcoin
DOGE's price swings continue to lean on the broader market's mood, and bitcoin price today direction plays a real part in how this consolidation resolves.
When Bitcoin trades with more conviction, DOGE's breakout or breakdown scenarios above tend to play out with added force, a reminder that even a coin with DOGE's liquidity still leans heavily on wider market sentiment.
Methodology
This Dogecoin price prediction is based on 4-hour candlestick data from Binance, EMA and RSI readings, and the trendline and consolidation structure visible on the chart since early September 2026.
The scenario levels above are tied to specific breakout or breakdown conditions and are not guaranteed outcomes.
Expert Opinion
Market commentators tracking DOGE's setup note that holding above a rising trendline through a tight consolidation phase like this one is typically read as constructive, provided that support doesn't give way.
Their view is that the coin's ability to hold that trendline is the more immediate thing to watch right now, since losing it would undercut the bullish case regardless of how the broader pattern develops.
Disclaimer: This Dogecoin price prediction is for informational purposes only and should not be treated as financial advice. Cryptocurrency markets are highly volatile, technical patterns can fail to play out as expected, and any of the scenarios described above carry a realistic probability of not occurring. Readers should conduct independent research before making any investment decisions.