Dogecoin has posted a sharp double-digit gain today, and the move comes with a technical breakout, notable whale activity, and a bullish chart signal all lining up at once. This dogecoin pric
Dogecoin has posted a sharp double-digit gain today, and the move comes with a technical breakout, notable whale activity, and a bullish chart signal all lining up at once.
This dogecoin price prediction breaks down what's driving the rally and where the price could head next.
Dogecoin launched in 2013 as a lighthearted, meme-inspired cryptocurrency built on a fork of Litecoin's codebase.
Despite its origins as a joke, dogecoin has grown into one of the largest cryptocurrencies by market capitalization, maintaining an active community and consistent trading volume across major exchanges.
The Dogecoin price today stands at $0.09977, up 12.1% over the past 24 hours.
The token's market capitalization has climbed to $15.572 billion, making today's move one of the more significant single-day gains among large-cap assets on Dogecoin News feeds.
Live Market Data
Metric
Value
Price
$0.09977
24h Change
+12.1%
24h Range
$0.08883 - $0.1056
Market Cap
$15.572B
Source: market data taken from CoinGecko, as of Sep 22, 2026. Figures may vary slightly across other tracking websites.
Dogecoin News Today: Breakout Strength and Whale Buying
Trader Tardigrade, a technical analyst account, described today's breakout candle as showing considerable strength, noting that a move of this size often signals a genuine momentum shift rather than a temporary spike. 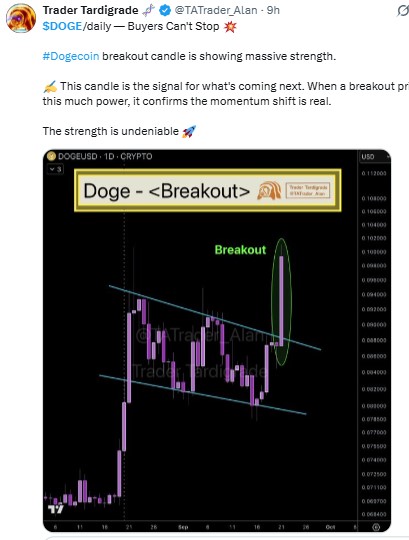
Source: Data Taken From @TATrader_Alan, X Account, as of Sep 22, 2026
The account framed the breakout as a signal worth watching closely in the sessions ahead.
Separately, an account tracking on-chain activity reported that Dogecoin whales purchased more than 360 million DOGE within the past 24 hours. 
Source: Data Taken From @Investment_CEO, X Account, as of Sep 22, 2026
Large accumulation of this size during a breakout is often interpreted as a sign of confidence from bigger holders, adding another layer of support to today's dogecoin news beyond the technical setup alone.
Technical Analysis: DOGE Breaks Out Of Descending Triangle
On the daily chart, DOGE had been consolidating inside a descending triangle, with a falling trendline capping upside attempts and a flat support line below.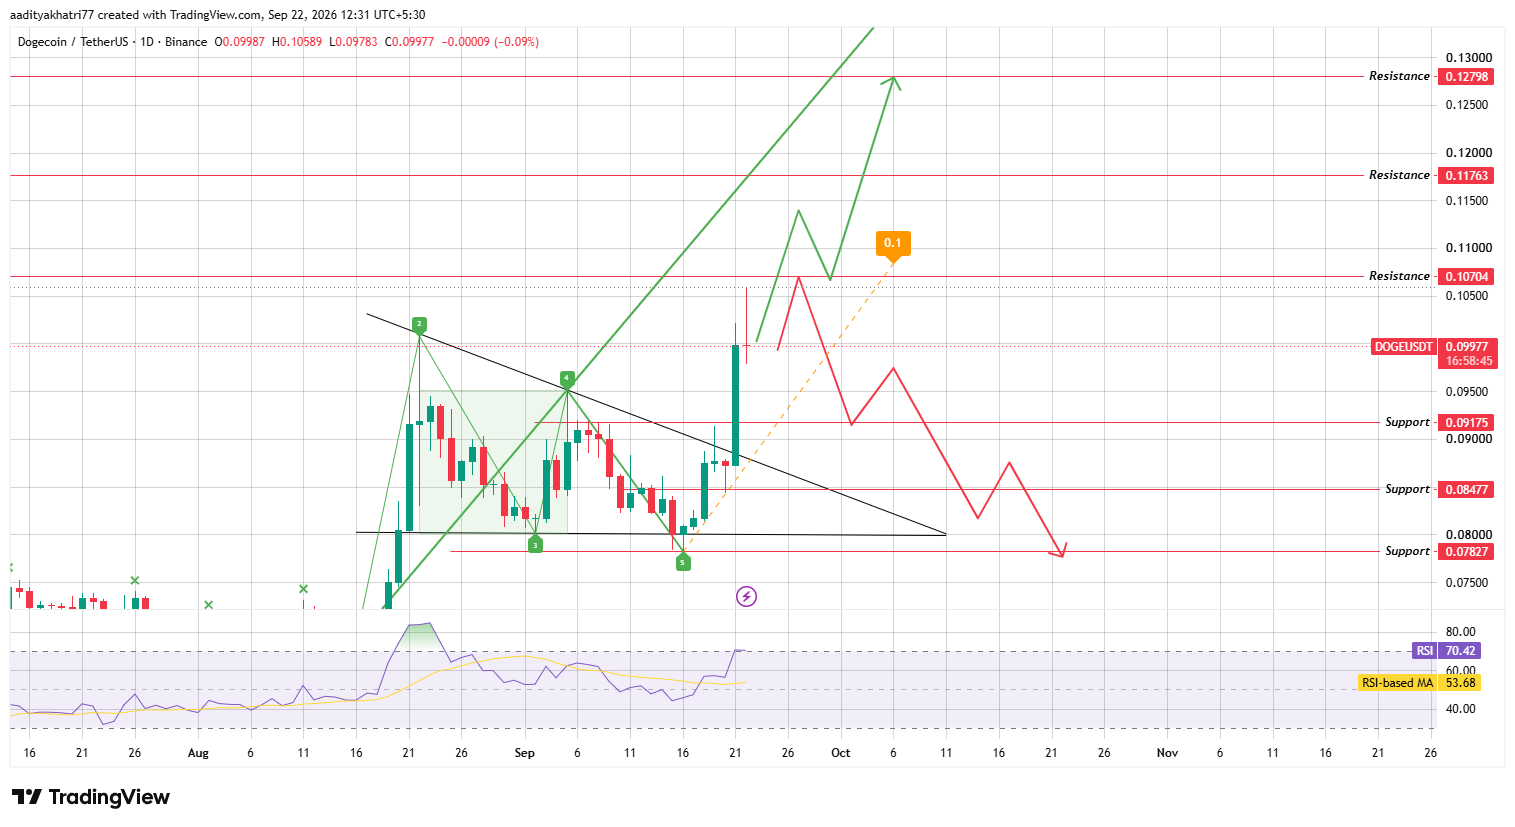
Source: Chart taken from TradingView, as of Sep 22, 2026
Today's session produced a high-volume candle that broke decisively above the falling trendline, a move that traders often treat as a stronger signal than a low-volume breakout.
RSI has climbed to 70.42, well above its moving average of 53.68, reflecting strong momentum, though the reading is now approaching overbought territory.
A Wolfe Wave pattern visible on the chart also points toward continued upside, projecting a target well above current resistance levels.
Can $DOGE Push Toward Higher Resistance?
If the price holds above the broken trendline and continues higher, the first resistance sits at $0.10704.
A confirmed close above that level would open the path toward $0.11763, and sustained buying could extend the move toward $0.12798, which aligns with the Wolfe Wave's projected target.
This scenario would confirm today's breakout as the start of a larger trend rather than a single-day spike.
What Happens If $DOGE Is Rejected?
If the price fails to hold above resistance and reverses lower, the first support to watch is $0.09175.
A break below that level would expose $0.08477, and continued selling pressure could extend the decline toward $0.07827.
Given the elevated RSI reading, some cooling off after today's sharp move would not be unusual even if the broader breakout structure remains intact.
Support and Resistance Levels
Support
Resistance
$0.09175
$0.10704
$0.08477
$0.11763
$0.07827
$0.12798
Bull, Base, and Bear Scenarios
Scenario
Setup
Level
Bull
Breakout holds, price clears resistance.
$0.10704 - $0.12798
Base
Price consolidates after the breakout candle
$0.09175 - $0.10704
Bear
Rejection and breakdown below support
$0.08477 - $0.07827
Dogecoin vs Bitcoin
DOGE's 12.1% gain today significantly outpaces typical Bitcoin volatility, pointing to asset-specific drivers rather than a broad market rally.
When Bitcoin trades within a narrower range, large-cap altcoins like $DOGE often see outsized moves tied to their own catalysts, and today's combination of a confirmed breakout, whale buying, and a bullish Wolfe Wave signal fits that pattern closely.
Methodology
This dogecoin technical analysis is based on daily candlestick data from Binance, sourced through TradingView, combined with live market data from CoinGecko.
Support and resistance levels are drawn from the descending triangle structure visible on the chart, and the Wolfe Wave pattern is used to project a potential upside target.
RSI readings are used to assess momentum. All figures reflect data captured as of September 22, 2026, and remain subject to change.
Expert Opinion
Analysts tracking breakout patterns note that high-volume candles breaking a multi-week trendline, combined with visible whale accumulation, tend to carry more weight than technical signals alone.
A confirmed close above $0.10704 would strengthen the case for continuation toward the Wolfe Wave target, while failure to hold the breakout level would suggest the move needs more time to consolidate.
Disclaimer: This article is for informational purposes only and should not be considered financial advice. Cryptocurrency markets are highly volatile, and prices can move sharply in either direction. The scenarios outlined above are based on current chart patterns and are not guaranteed outcomes. Readers should conduct their own research and consider their risk tolerance before making any investment decisions.