Dogecoin, the original memecoin launched in 2013 as a lighthearted spinoff of Bitcoin, has grown into one of the most traded digital assets by retail volume. It currently trades around $0.095
Dogecoin, the original memecoin launched in 2013 as a lighthearted spinoff of Bitcoin, has grown into one of the most traded digital assets by retail volume.
It currently trades around $0.09575, up sharply over the past day.
This Dogecoin price prediction looks at where $DOGE could head next based on chart structure, on-chain positioning, derivatives data, and recent catalysts.
Live Market Data
Metric
Value
Price
$0.09575
24h Change
+16.5%
24h Range
$0.08179 - $0.09685
Market Cap
$14.886B
Fully Diluted Valuation
$14.886B
24h Trading Volume
$2.169B
Circulating Supply
155.593B DOGE
Max Supply
Infinite
Source: $DOGE market cap data taken from Coingecko, data as of Aug 22, 2026. Figures may vary slightly across other tracking websites.
Liquidation Snapshot
Window
Total Liquidated
Longs
Shorts
1 Hour
$1.44M
$307.44K
$1.14M
4 Hour
$2.74M
$1.10M
$1.64M
12 Hour
$10.00M
$3.32M
$6.68M
24 Hour
$14.17M
$5.23M
$8.94M
Source: liquidation data taken from Coinglass.
Shorts have absorbed the bulk of the damage in every window tracked, roughly double the long-side losses on the 24-hour count.
That kind of lopsided liquidation pattern usually points to short covering fueling part of this move, which lines up with the sharp 16.5% daily candle.
Exchange Volume
Futures trading in $DOGE is heavily concentrated on a handful of venues. Binance leads with $1.33B in 24-hour futures volume, followed by OKX at $924.36M and Bybit at $565.97M. 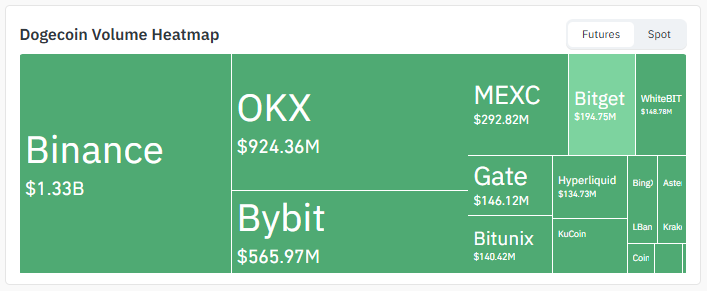
Source: Volume Heatmap Data Taken From Coinglass.
MEXC, Bitget, Gate, WhiteBIT, Bitunix, and Hyperliquid round out the mid-tier venues, each clearing over $130M.
This kind of volume spread across major and mid-sized exchanges suggests the current leg up isn't isolated to one platform's order book, which adds some weight to this Dogecoin price prediction rather than dismissing it as a thin-liquidity spike.
Social Sentiment for $DOGE
Ichimoku Structure Watch Chart watchers following the Ichimoku cloud structure on the 4H timeframe have flagged the recent Kumo breakout as an early but meaningful shift. 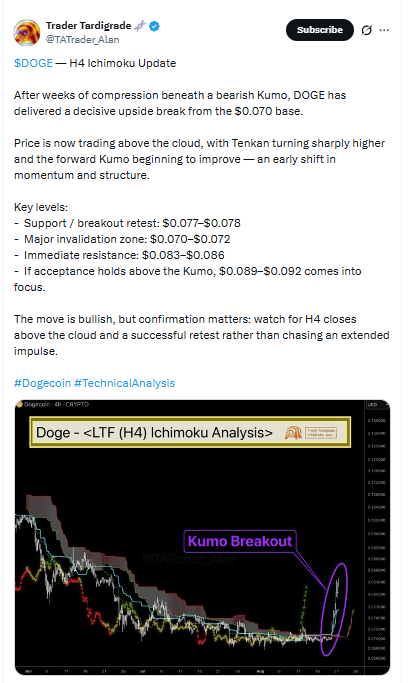
Source: Data Taken From @TaTraderAlen, X Account.
The retest zone just under the current price is being treated as the level to watch, with a confirmed close above the cloud seen as the real trigger rather than the initial break itself.
On-Chain Support Read Researchers tracking DOGE's URPD distribution point to the $0.081 zone as one of the coin's most significant support levels historically, given the sheer volume that last changed hands there. 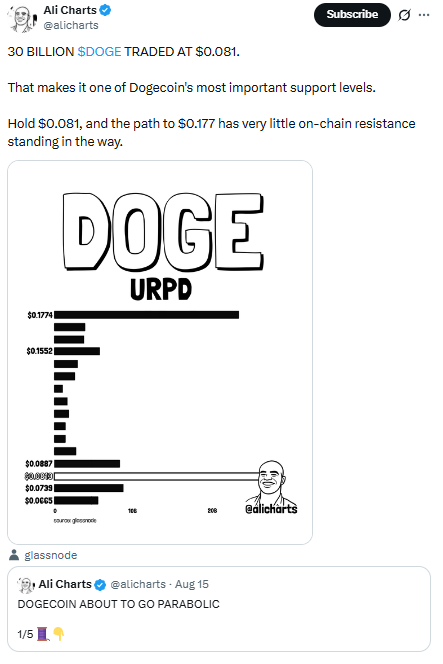
Source: Data Taken From @alicharts, X Account.
Very little realized volume sits between that level and the $0.177 mark, meaning fewer sellers are likely to defend that stretch if momentum keeps building.
ETF Flow Catalyst Spot DOGE ETFs recorded their largest single-day net inflow since May on August 20, pulling in roughly $654,000 after a multi-week dry spell with no inflows at all since early August. 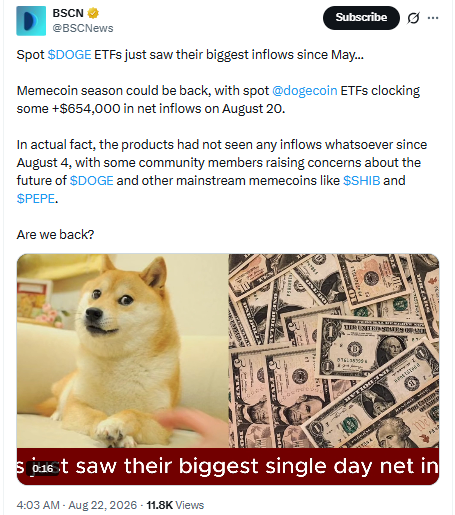
Source: Data Taken From @BSCNews, X Account.
It's a modest number on its own, but the shift from zero to positive flow is the kind of small signal that often gets read as institutional appetite for memecoin exposure quietly returning.
Key Takeaways
DOGE is trading near $0.09575, up 16.5% in 24 hours, after breaking above a bearish Ichimoku cloud on the 4H chart.
The weekly chart shows DOGE breaking a falling trendline for the second time since 2024, a setup that previously preceded a 382% rally.
On-chain data shows $0.081 as a heavyweight support zone, with thin resistance on the way to $0.177.
Shorts have taken the bigger liquidation hit across every timeframe, a sign of squeeze pressure building.
Spot DOGE ETFs logged fresh net inflows on August 20, their first since early August.
Technical Analysis
4-Hour Chart: Ichimoku Cloud Breakout
After weeks of compression beneath a bearish Kumo, $DOGE delivered a decisive upside break from its $0.070 base.
Price now trades above the cloud, Tenkan-sen is turning higher, and the forward Kumo is starting to improve, an early sign of a momentum shift. 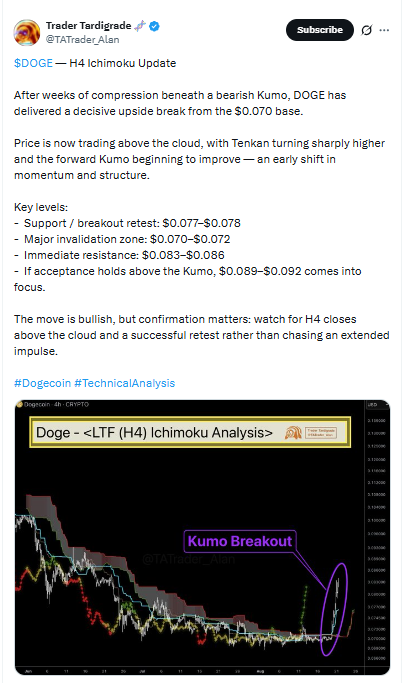
Source: Chart Data Taken From @TaTraderAlen, X Handle.
The breakout retest zone sits at $0.077 to $0.078, while $0.070 to $0.072 marks the level that would undo this structure entirely. Immediate resistance runs $0.083 to $0.086.
This Dogecoin price prediction treats a clean 4H close above the cloud, followed by a successful retest, as the real confirmation trigger rather than the initial breakout candle itself.
If acceptance holds, $0.089 to $0.092 comes into focus next, setting up a push toward higher weekly resistance bands.
Weekly Chart: A Trendline Breakout That Rhymes With 2024
Here's where it gets interesting. In September 2024, $DOGE spent months grinding beneath a falling trendline on the weekly chart.
When that trendline finally broke, price ran 382% in just 10 candles, backed by a massive 249 billion volume spike that confirmed real participation, not a fakeout. Fast forward to August 2026, and the chart is telling a familiar story. 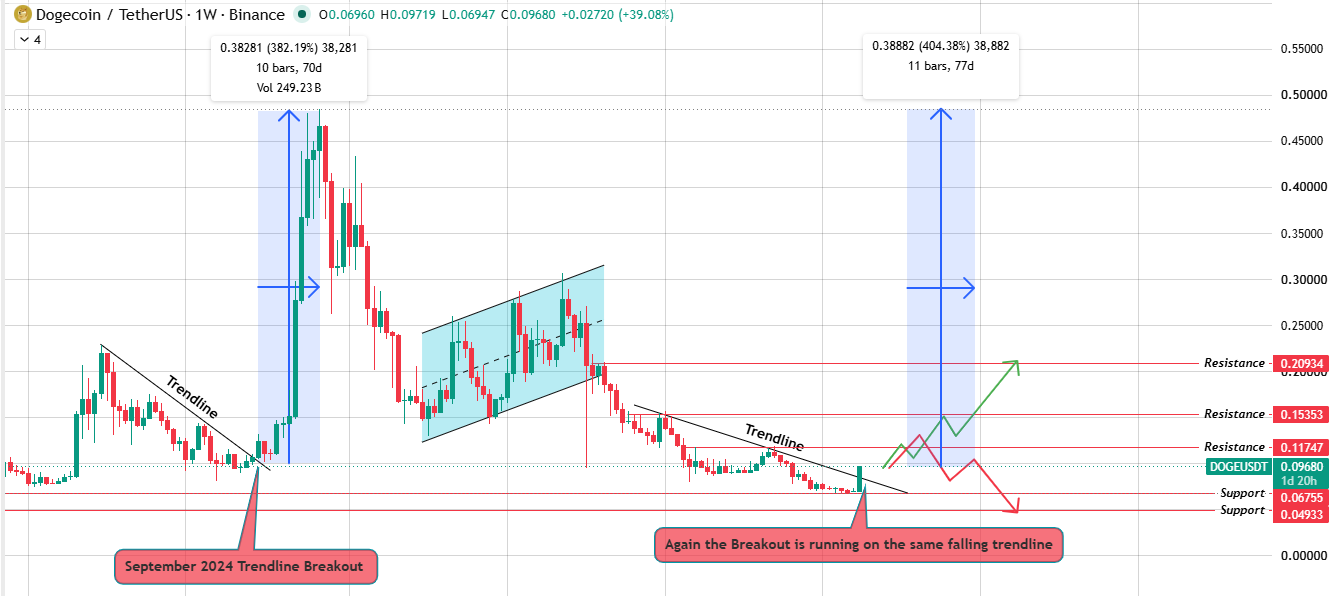
Source: Chart Taken From TradingView.
$DOGE has been compressing under a fresh falling trendline since the 2024 top, and it is now breaking above it in a structurally similar way.
Nobody can promise the same magnitude twice. But the pattern itself, prolonged compression followed by a trendline break, has historically opened the door to outsized moves in this asset.
A weekly close above the trendline, not just a wick through it, is what would validate this Dogecoin price prediction scenario.
Support and Resistance Levels
Level Type
Price
Resistance 3
$0.20934
Resistance 2
$0.15353
Resistance 1
$0.11747
Immediate Resistance
$0.083 - $0.086
Current Price
$0.09575
Breakout Retest Support
$0.077 - $0.078
Major Invalidation Zone
$0.070 - $0.072
Support 1
$0.06755
Support 2
$0.04933
Bull, Base, and Bear Case
Scenario
Setup
LevelInvalidation
Bull
Weekly close holds above the falling trendline, and 4H stays above the Ichimoku cloud.
$0.15353 - $0.20934
Below $0.06755
Base
Price consolidates between the retest zone and immediate resistance.
$0.083 - $0.092
Loss of $0.070 base
Bear
A trendline breakout fails, and the price slips back under the cloud.
$0.070 - $0.072
Below $0.04933
Glossary
Ichimoku Cloud (Kumo): A Japanese charting system that uses several moving averages to define trend direction, support, and resistance zones all at once. Traders watch for price closing above or below the "cloud" as a trend signal.
Trendline Breakout: Simply put, this is when price finally punches through a line that had been capping or supporting it for a long stretch. The longer the compression beforehand, the more attention the eventual break tends to get.
URPD (UTXO Realized Price Distribution):An on-chain tool showing how much of a coin's supply last moved at each price level. Thick bars mean lots of coins changed hands there; thin bars mean the opposite, so it hints at where future support or resistance might sit.
Liquidation: What happens when a leveraged futures position gets forcibly closed because the trader can no longer cover losses. Heavy short liquidations often coincide with sharp upward price spikes.
Invalidation Zone: The price range where a bullish or bearish setup stops making sense and needs to be thrown out. Not a stop-loss exactly, more like the point where the chart story falls apart.
Spot ETF Inflows: Net new money flowing into exchange-traded funds that hold the actual underlying asset. Positive inflows generally reflect fresh buying demand from investors who prefer regulated fund exposure over holding coins directly.
Methodology
This Dogecoin price prediction is built from multi-timeframe technical analysis (4H Ichimoku, weekly trendline structure) and on-chain URPD distribution data. via Glassnode, live liquidation and exchange volume data from Coinglass, and current market data.
All price levels referenced are derived directly from the charts and data sources provided, with no extrapolated or speculative levels.
Disclaimer: This article is for informational purposes only and does not constitute financial, investment, or trading advice. Cryptocurrency markets, including Dogecoin, are highly volatile and speculative. Any price levels, targets, or scenarios discussed are probability-based observations drawn from technical and on-chain data, not guarantees. Please conduct your own research and consult a qualified financial advisor before making investment decisions.