Key Takeaways DOGE trades between $0.068 and $0.071, near its lowest level since late 2023. Price remains below all three major daily SMAs. CVDD signals rare undervaluation, not a confirmed b
Key Takeaways
- DOGE trades between $0.068 and $0.071, near its lowest level since late 2023.
- Price remains below all three major daily SMAs.
- CVDD signals rare undervaluation, not a confirmed bottom.
- Above $0.072, $0.073-$0.074 becomes the key test.
- A daily close below $0.068 would break the range.
Dogecoin Has Stopped Falling, Not Started Recovering
Dogecoin was trading near $0.0698 on August 16, little changed over both 24 hours and seven days. Since the sharp July 23 decline, most daily closes have clustered around $0.069-$0.071, with buyers repeatedly appearing near $0.068.
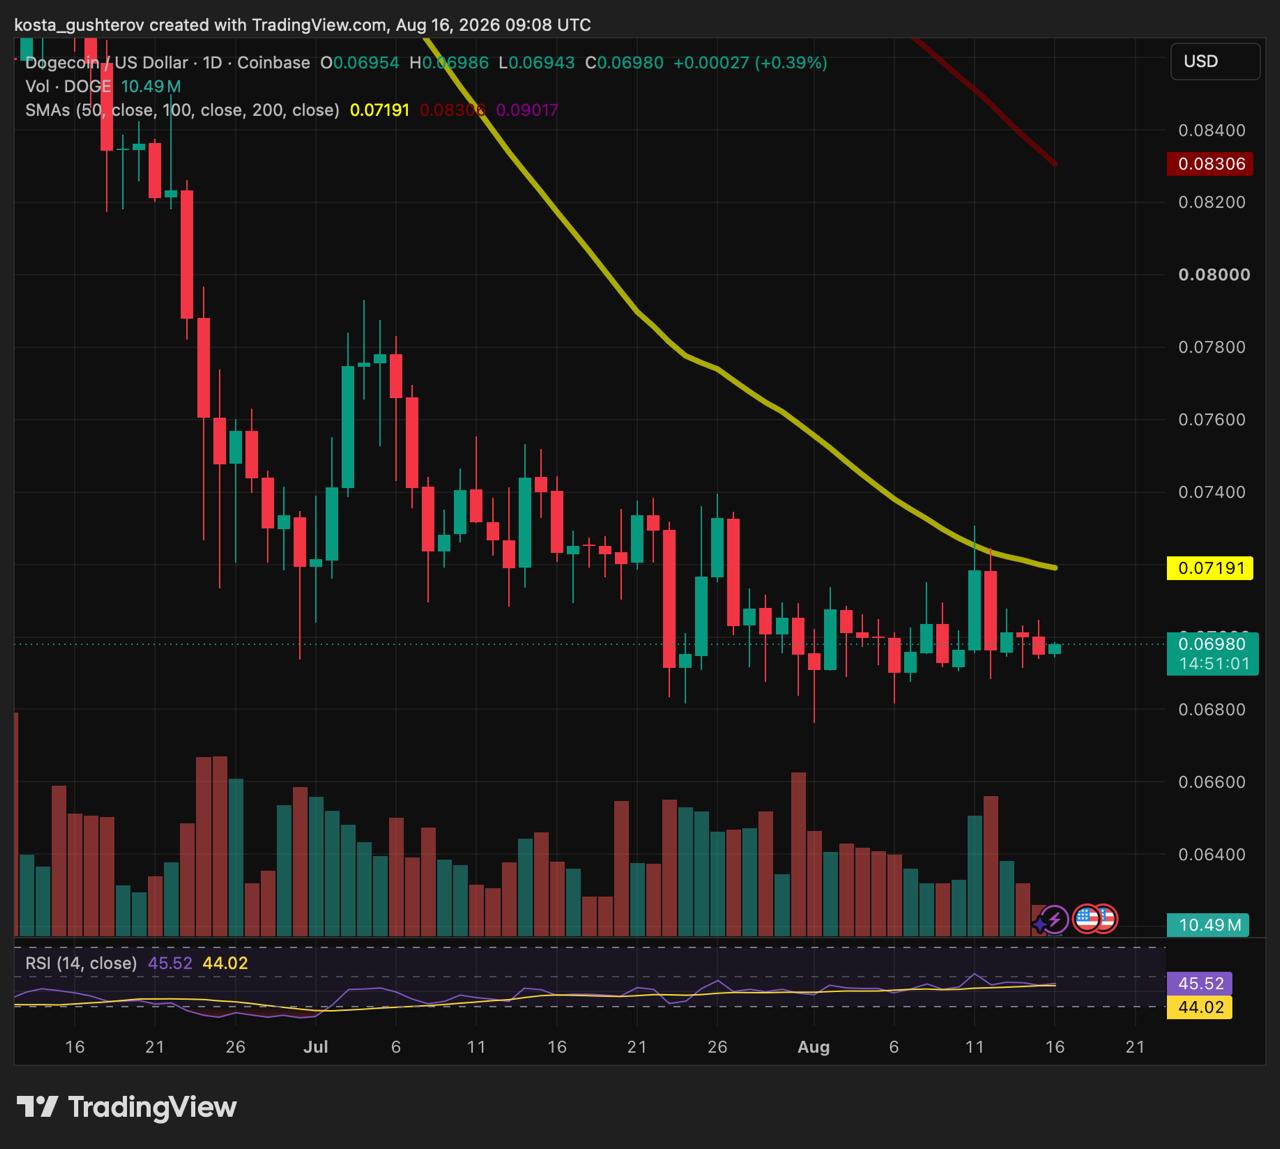
Dogecoin daily chart showing DOGE trading near $0.0698 inside its recent range.
That leaves DOGE around its weakest price since November 2023. Historical price data shows that the current area was last traded nearly three years ago, before DOGE moved above $0.08 later that month.
The halt matters because sellers are no longer pushing DOGE to new daily lows. It does not confirm accumulation. Recovery attempts have continued to form lower highs, falling from roughly $0.078 in early July to around $0.074 later in the month and close to $0.073 in August.
The August 11 bounce shows the problem. DOGE briefly pushed toward $0.073 on stronger volume, met the descending 50-day simple moving average and quickly returned to the range. Buyers were still present near the lows, but demand disappeared around resistance.
The Range Has Two Clear Boundaries
The first support zone sits between $0.068 and $0.069. DOGE has traded through parts of that band several times without producing a sustained daily break. Its recent intraday low near $0.068 marks the lower edge and the weakest price recorded during the current 52-week period.
A wick below $0.068 would not settle the issue on its own. A daily close beneath the level, particularly if followed by a failed attempt to recover it, would favor further downside over continued base-building. Looking back to 2023, the nearest visible support under that level sits around $0.066.
Resistance begins around $0.071-$0.0715 and strengthens at the 50-day SMA near $0.072. Because the average is falling, DOGE no longer needs as large a rally to test it. Reclaiming it still matters: a close above the average followed by a successful retest would be the first evidence that the range is resolving upward.
The more important test sits between $0.073 and $0.074, where several recovery attempts have failed. Clearing that area would break the recent sequence of lower highs. DOGE would still be below the 100-day SMA near $0.083 and the 200-day SMA around $0.09, so a local breakout would not by itself reverse the broader downtrend.
Volume has contracted during the sideways phase. Fewer active sellers can help a market stabilize, but light participation also means buyers have not committed enough capital to push price out of the range. A credible breakout should therefore hold above resistance with stronger volume, not merely trade above it for part of one session.
The CVDD Signal Changes the Risk Picture, Not the Trend
Alphractal founder Joao Wedson examined the decline through his long-term CVDD Channel. The model places DOGE at or below its lower band, a region reached only a small number of times in Dogecoin’s history.
CVDD uses on-chain coin movement and the age of the transacted supply to place price in a long-term valuation framework. Wedson’s chart shows that previous visits to its extreme lower region came before major recoveries over the following months.
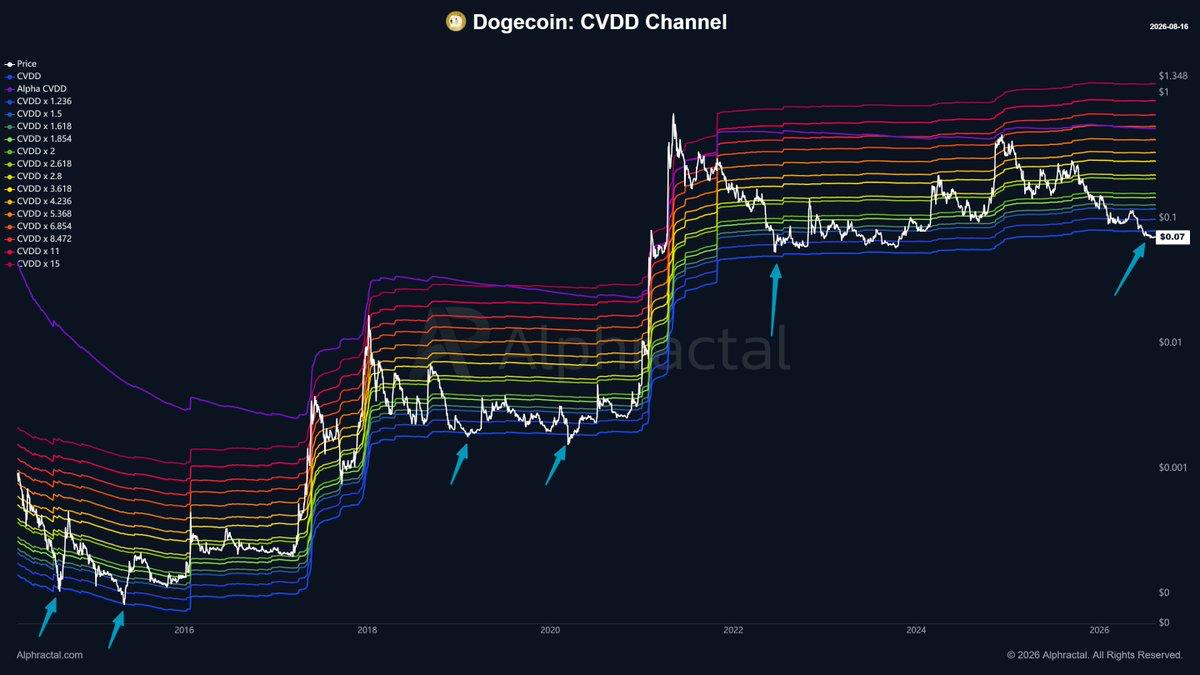
An Alphractal long-term logarithmic chart of Dogecoin using the CVDD Channel model from 2014 through August 2026, highlighting earlier cycle lows near the lower boundary.
That history is notable, but it cannot be taken as a forecast. The sample is small, each episode occurred under different market conditions, and DOGE can remain below a valuation boundary before demand returns. Wedson also stopped short of calling a confirmed bottom.
The colored bands above DOGE should not be read as near-term price targets. They are parts of the model’s valuation channel, not predictions that price will automatically travel from the lower band to the upper one.
The daily chart supplies the timing that Wedson’s model does not. CVDD suggests that DOGE is unusually cheap relative to its own on-chain history; price shows whether buyers have begun acting on that valuation. So far, they have defended $0.068 but failed to hold above the 50-day SMA. DOGE may be in a historically low valuation region without having formed a tradable bottom.
The combination creates a cleaner test than either chart provides alone. Reclaiming $0.072 and then $0.073-$0.074 would show that the valuation extreme is beginning to attract sustained demand. Losing $0.068 would show that DOGE can become still cheaper before it becomes stronger.
ETF Flows Show Why Valuation Alone Is Not Enough
Recent U.S. fund data helps explain why the valuation signal has not translated into a breakout. SoSoValue’s spot Dogecoin ETF tracker showed no net inflow on August 14 and approximately $11.6 million in cumulative net inflows.
For perspective, those cumulative inflows equal roughly 0.1% of Dogecoin’s approximately $10.9 billion market value. ETF demand is only one part of the market and should not be treated as the sole driver, but the figures show that this channel is not yet large enough to explain a sustained recovery. DOGE has become more stable; it has not attracted a clearly stronger bid.
READ MORE:
 Europe’s Crypto Week Ahead: Inflation, PMIs and Rates
The Final Read
The next meaningful signal will come from how DOGE behaves after leaving the range, not from another move inside it. A breakout that holds would show that demand is finally improving; a breakdown followed by a failed recovery would show that the base has not held.
The distinction between valuation and timing remains important. CVDD can continue showing historical undervaluation even if price falls further, making it useful as long-term context rather than proof that the bottom is already in.
Cryptocurrency prices are highly volatile. Technical levels are based on the supplied daily chart and may change as new market data becomes available. Historical indicator behavior does not guarantee future results. This article is for informational purposes only and does not constitute investment advice.
The post Dogecoin Sits at a Rare Extreme With $0.068 on the Line appeared first on Coindoo.