
Altcoins1 min read
美国SOL现货ETF单日净流出1266.8万美元:资金动向解读
美国 SOL 现货 ETF 单日录得净流出 1266.8 万美元,反映当日相关产品面临的资金赎回压力。这一数据来自 ETF 资金流追踪,代表当日申购与赎回之间的净差额,是观察机构与零售资金对 Solana 敞口态度的重要切入点。 1266.8 万美元净流出意味着什么 根据 Farside Investors 的 SOL ETF 流量数据,美国 SOL 现货 ETF 当日净流出达
Dogecoin whales reportedly accumulated 600 million DOGE since October 12, reinforcing a potential recovery case near $0.081 support. Ali Charts cites a daily TD Sequential buy signal and a 36

Dogecoin trades near $0.08048 as persistent selling pressure tests support around $0.0800, while analyst Ali Charts identifies three reasons for potential recovery. His bullish case centers on a daily TD Sequential buy signal near $0.081, a major on-chain cost-basis zone, and whale accumulation. However, the four-hour chart still shows a bearish trend.
According to Ali Charts, Dogecoin’s daily chart produced a TD Sequential buy signal near $0.081. The indicator has previously identified potential turning points for DOGE, making this level central to his analysis.
https://twitter.com/alicharts/status/2111066157138559166?s=20Notably, URPD data shows approximately 36 billion DOGE previously changed hands around $0.081. This concentration makes the price level important to watch, although it does not guarantee buyers will defend it.
Whale activity provides the third factor. Since October 12, large holders have reportedly accumulated approximately 600 million DOGE near the support zone. Ali links this buying activity with the technical signal and the concentration of previous transactions.
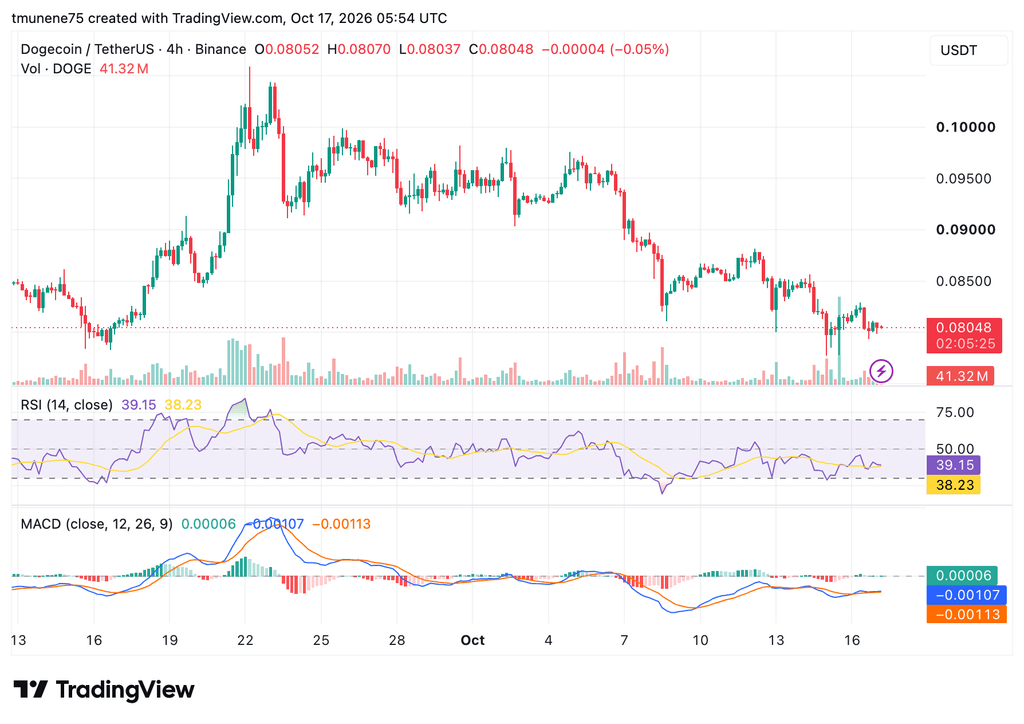
Despite these factors, DOGE’s four-hour Binance chart shows continued weakness. The token trades at $0.08048, down 0.05% on the latest candle, which opened at $0.08052 and reached a high of $0.08070 and low of $0.08037. Trading volume stands at 41.32 million DOGE.
 Source: TradingView
DOGE climbed from approximately $0.078 around September 16 to nearly $0.104 on September 22. However, the price subsequently formed lower highs and lower lows, with selling pressure accelerating around October 7. It then fell below $0.094 before declining toward $0.083 and its current level.
Support lies near $0.0800, while a breakdown could expose $0.0780 and previous lows around 0.0770–0.0780. On the upside, DOGE needs to reclaim 0.0820–0.0830, followed by resistance at $0.0850 and $0.0870. The $0.0900 level presents another barrier.
The Relative Strength Index is at 39.15, slightly above its average of 38.23. However, it remains below 50, indicating continued bearish pressure, while DOGE has not reached the conventional oversold threshold below 30.
Meanwhile, the MACD histogram is marginally positive at 0.00006. The MACD line at -0.00107 is slightly above the signal line at -0.00113, although both remain below zero.
Ali identifies 0.16–0.17 as a potential profit-taking zone if $0.081 holds and DOGE rebounds. Cost-basis data shows roughly 12 billion DOGE acquired near $0.16 and another 14 billion near $0.17.