Can a token that fell from Nov 6 to Nov 15 hold a 17% pop when Fear and Greed sits at 11? That's the test for this ELSA price prediction, and it starts at the 100 EMA near $0.06484. Price tra
Can a token that fell from Nov 6 to Nov 15 hold a 17% pop when Fear and Greed sits at 11?
That's the test for this ELSA price prediction, and it starts at the 100 EMA near $0.06484. Price trades near $0.069 as of 09:53 UTC, and traders can compare it withother altcoin setups.
ELSA Price Prediction Data Snapshot, Nov 21, 09:53 UTC
A big move is on. ELSA's price today is $0.06865, up 17.8% in 24 hours onCoinGecko market data.
Volume: the coins changing hands hit $7.44M on DEX pools. CoinGecko's market cap is $21.076M.
ELSA futures open interest, the cash tied up in open bets, is $12.17M, up 63.86%. The funding rate, a fee for long pay shorts, sits at 0.0208%.
ELSA Technical Analysis on the 4H Chart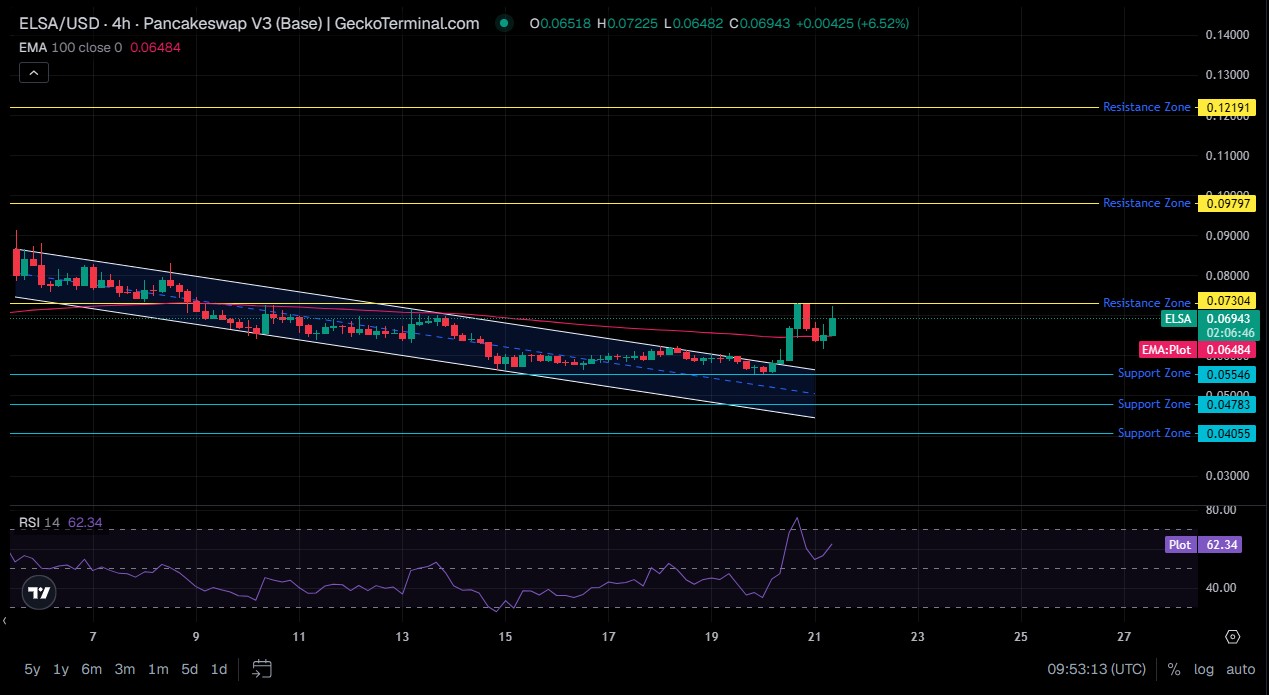
This ELSA technical analysis uses theGeckoTerminal 4H chart for ELSA/USD on the Base network. The price starts near $0.09 in early November.
From there it fell inside a descending channel, a pair of sloping lines that frame lower highs and lower lows. Most bounces stalled under the 100 EMA.
Around Nov 14 and Nov 15, the price hit $0.05546, a support level where buyers stepped in. RSI dipped near 30.
Then candles got small, and the price held between $0.05546 and roughly $0.06 for days.
Nov 20 broke the pattern. A tall green candle cleared the channel's upper line, crossed the 100 EMA, and pushed RSI near 75.
Sellers met it at $0.07304, a resistance level where they've shown up before.
A pullback, a short dip after a rise, followed. The latest 4H candle opened at $0.06518, touched $0.06482, a tick under the 100 EMA, and rebounded to $0.06943.
On first glance, that's a clean breakout. The price hasn't traded above $0.07304 yet.
But the average held, and RSI at 62.34 sits well under the 75 peak.
Bybit Versus Binance Futures Positioning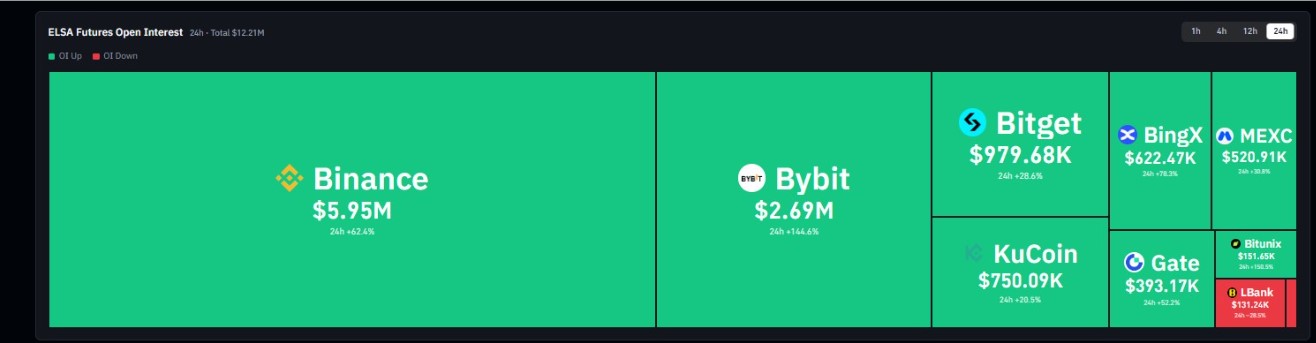
Binance holds the biggest share of open interest at $5.95M, up 62.4%. Bybit holds $2.69M after a 144.6% jump. Faster than the other four big venues.
OnCoinGlass futures data, Binance shows a net outflow of $1.09M, and Bybit shows an inflow of $166.97K.
Liquidations, forced exits of margin trades, total $207.63K, and longs took 66%.
That's a futures-led bounce. And forced selling comes fast.
Thin Liquidity Behind the Rally
Liquidity, the cash in a pool that absorbs trades, is just $474.9K on GeckoTerminal. Yet 24H DEX volume is $7.44M, more than 15 times that.
Peers covered inAI token news make a fair depth comparison. So who's buying the spot move?
DEX data counts 46,501 buys against 47,773 sells, yet net buy is +$45.77K.
The top 10 wallets hold 89.19% of the supply, and the top address holds 71.10%. Unlabeled, so it may be a treasury.
Elsa Stack Post and the Catalyst Question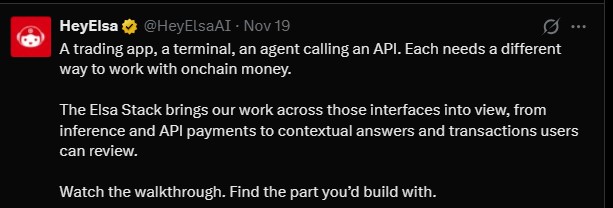
TheHeyElsa X post from Nov 19 frames trading apps and AI agents calling an API as separate users of on-chain money.
It adds a video walkthrough covering inference, API payments, and reviewable transactions. Call it a product update.
ELSA Price Prediction Scenarios
The short-term ELSA price forecast is bullish above $0.06484.
Scenario
Trigger
Target
Invalidation
Liquidity Condition
Bull
Break and hold above $0.07304
$0.09797, then $0.12191
Trades under $0.06484
Volume rises, spot inflow turns positive
Base
Range above the 100 EMA
$0.06484 to $0.07304
Break either side
Flat volume, OI steady
Bear
Loses $0.06484
$0.05546, then $0.04783
Reclaims $0.07304
Long liquidated, OI drops
A hold above $0.07304 over 7D to 30D opens $0.09797, about 41% higher, then $0.12191.
Range trading between $0.06484 and $0.07304 for 7D is the base case.
Under $0.06484, the bear case sends prices to $0.05546, then $0.04783, and $0.04055 over 30D.
Fresh spot venues add depth, soexchange listing updates matter.
A HeyElsa price prediction beyond 30D lacks enough evidence, so this one stops there.
ELSA Price Target Levels to Watch
ELSA support and resistance form a ladder. Floors sit at $0.06484, $0.05546, $0.04783, and $0.04055.
Sellers defended $0.07304, and the 24H high is $0.07334. Above that, $0.09797 and $0.12191 are next.
A confirmed breakout needs a 4H candle above $0.07334.
The nearest ELSA price target is $0.09797, about 41% above the latest price.
Traders asking if ELSA can reach $0.10 need a 44% gain from $0.06943 and that break first.
Breakdown risk starts with a 4H candle trading under $0.06484. This ELSA price prediction stays bullish if that level holds.
Risks to the ELSA Price Outlook
CoinGlass lists spot net flow at -$46.0M, which doesn't fit a 17% rise. Either that number is off or sellers are using the strength to exit.
Fear and Greed sits at 11. A broad market drop would hit a token with $474.9K of liquidity hard.
All of it comes back to $0.06484. And if that average fails, the $0.05546 floor sits about 20% under the latest price.
Disclaimer: This article is for information only and isn't financial advice. Crypto prices swing fast and can fall to zero. Data comes from CoinGecko, CoinGlass, and GeckoTerminal as of 09:53 UTC on Nov 21, 2026. Readers should research before trading.