BitcoinWorld EUR/GBP Slides as Bearish Pressure Mounts: What’s Driving the Move? The euro weakened against the British pound on Tuesday, with EUR/GBP slipping to a fresh session low as bearis
BitcoinWorld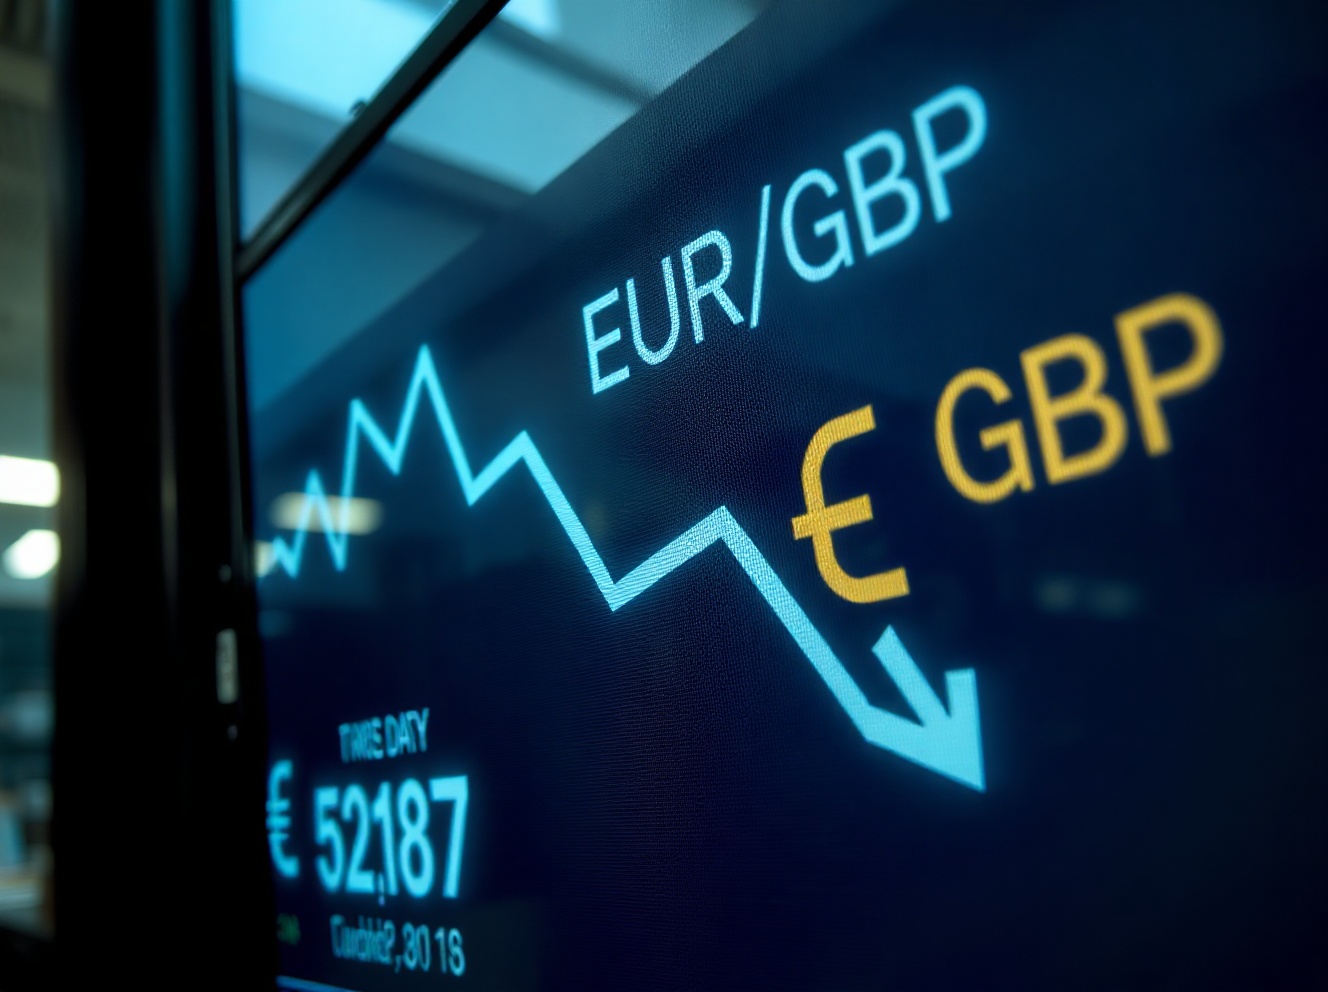 EUR/GBP Slides as Bearish Pressure Mounts: What’s Driving the Move?
The euro weakened against the British pound on Tuesday, with EUR/GBP slipping to a fresh session low as bearish momentum intensified, according to chart analysis from market observers. The pair, which has been under pressure in recent sessions, reflects growing market confidence in the UK economy relative to the eurozone.
What’s Behind the Bearish Pressure on EUR/GBP?
Technical indicators suggest that sellers are firmly in control, with the pair breaking below key support levels. The move comes amid a backdrop of divergent monetary policy expectations between the European Central Bank and the Bank of England, as investors price in a more hawkish stance from the BoE.
Recent economic data from the UK, including stronger-than-expected retail sales and a resilient labor market, have supported the pound. Meanwhile, the eurozone continues to grapple with sluggish growth and softer inflation, which has weighed on the single currency.
Key Levels to Watch in EUR/GBP
Analysts are closely monitoring the 0.8500 level as the next major support, with a break below that potentially opening the door to further downside toward 0.8450. On the upside, resistance is seen at 0.8550, followed by the 20-day moving average near 0.8580.
Chart patterns show a series of lower highs and lower lows, confirming the bearish trend. The Relative Strength Index (RSI) is hovering near oversold territory, suggesting that a short-term bounce could occur, but the overall bias remains negative.
Why This Matters for Forex Traders
For traders, the ongoing weakness in EUR/GBP presents both risks and opportunities. Those holding long euro positions may face further losses, while short sellers could benefit from the continuation of the downtrend. However, with the RSI approaching oversold conditions, caution is advised, as a technical rebound could lead to short-term volatility.
Conclusion
In summary, EUR/GBP is under pressure as bearish momentum builds, driven by fundamental and technical factors. Traders should keep an eye on upcoming UK inflation data and ECB policy signals for the next directional catalyst. The pair’s near-term outlook remains tilted to the downside, but oversold conditions warrant vigilance for a potential corrective bounce.
FAQs
Q1: What does bearish pressure on EUR/GBP mean?Bearish pressure indicates that the euro is losing value relative to the pound, with the exchange rate trending downward. This is often driven by market sentiment, economic data, or central bank policy expectations.
Q2: What are the key support and resistance levels for EUR/GBP?As of the latest analysis, support is seen at 0.8500 and 0.8450, while resistance lies at 0.8550 and the 20-day moving average near 0.8580. These levels are based on recent price action and technical indicators.
Q3: How can traders trade EUR/GBP during this trend?Traders may consider short positions if the pair breaks below support, but should watch for oversold conditions that could trigger a bounce. Using stop-loss orders and monitoring economic news is essential to manage risk.
This post EUR/GBP Slides as Bearish Pressure Mounts: What’s Driving the Move? first appeared on BitcoinWorld.