EUR/USD remains under pressure after a prolonged decline from the 1.16-1.17 region, and TradingView analyst Forex_Profit_SMC-FVG believes the pair could still have more downside ahead. His da
EUR/USD remains under pressure after a prolonged decline from the 1.16-1.17 region, and TradingView analyst Forex_Profit_SMC-FVG believes the pair could still have more downside ahead.
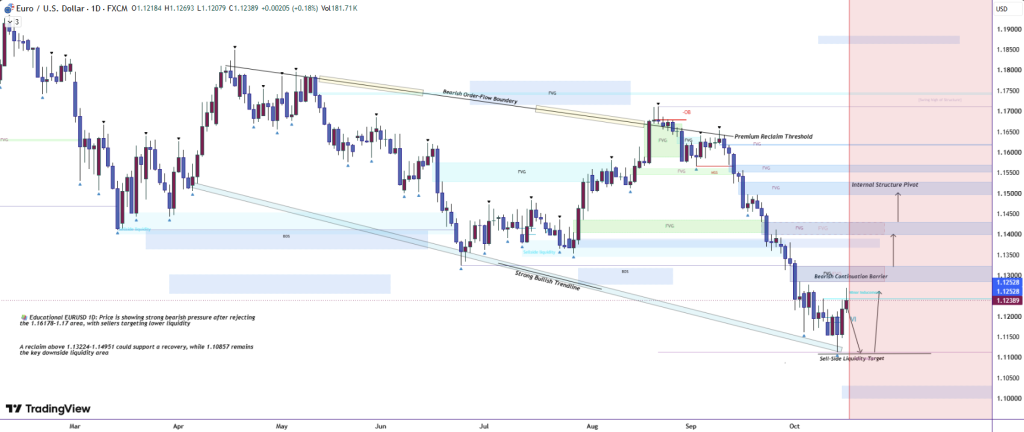
His daily chart shows EUR/USD near 1.124, with the broader structure defined by lower highs, lower lows and repeated failures to reclaim former support. The key bearish sequence in his analysis is straightforward: rejection from premium pricing, a shift in order flow, loss of internal support and then continued movement toward sell-side liquidity.
Why the Chart Still Favors Sellers
The analyst identifies 1.16178-1.17000 as the area where the latest recovery failed. Price reached that zone, produced rejection wicks and then turned lower.
From there, EUR/USD lost several fair-value-gap areas before breaking below the 1.14951 internal structure pivot. The next important level was 1.13224, and price has now moved below that barrier as well.
That leaves the marked sell-side liquidity target near 1.10857 as the deeper bearish objective.
 Source: tradingview.com
The chart also shows a descending order-flow boundary stretching across previous highs. As long as EUR/USD remains underneath that line and continues forming lower highs, his bearish thesis stays intact.
The recovery path is different. A move back above 1.13224 could interrupt the decline, but 1.14951 would need to be reclaimed before the daily structure starts looking materially healthier.
Fair Value Gaps and Liquidity Give the Setup More Depth
The analyst’s thesis is not based only on a falling trendline.
His chart maps several fair value gaps, order blocks and liquidity pools created during earlier price dislocations. These zones help explain why EUR/USD has reacted repeatedly around specific areas instead of moving lower in a straight line.
The sequence started with a sell-side liquidity sweep, followed by a temporary bullish recovery that carried EUR/USD back toward the 1.16-1.17 premium region. That move failed to produce a sustainable higher high, which became an important clue that buyers had not regained control.
After the rejection, price broke through internal support and moved below multiple FVG zones. In his framework, those breaks strengthen the bearish order-flow argument because areas that previously attracted buyers stopped holding.
The latest candles are now compressing close to the bottom of the structure.
That compression can produce a short-term bounce, but the analyst does not treat it as bullish confirmation. For that to happen, EUR/USD would need to reclaim the nearby bearish continuation barrier first, then recover 1.13224 and eventually 1.14951.
Until then, the 1.10857 liquidity pool remains the downside area his chart is pointing toward.
Macro Conditions Still Matter for EUR/USD
The fundamental backdrop also explains why the pair has struggled.
Hotter U.S. inflation recently pushed the dollar to an 18-month high as traders reconsidered the possibility of additional Federal Reserve tightening. September U.S. CPI rose 3.7% year over year, above expectations, strengthening the dollar against the euro.
Europe faces its own inflation problem. Euro-area inflation remained elevated at 3.8% in September, and the IMF expects at least one more 25-basis-point ECB increase this year. Higher ECB rates can support the euro, but tighter financial conditions and weaker growth can offset that effect.
For the short term, 1.13224 is the first recovery level to monitor. Staying below it leaves 1.10857 in play. A stronger move above 1.14951 would be the first real sign that the bearish sequence is beginning to break down.
For more financial news and price predictions, click here.
Subscribe to our YouTube channel for daily crypto updates, market insights, and expert analysis.
The post EUR/USD Price Prediction: Analyst Warns Bearish Structure Could Push Euro Toward $1.11 appeared first on CaptainAltcoin.