Buyers still need a daily candle above the resistance level at $5.94 to reach $7.72 after a 34.52% gain in 24h. This EVAA Protocol price prediction begins with EVAA trading far higher after a
Buyers still need a daily candle above the resistance level at $5.94 to reach $7.72 after a 34.52% gain in 24h.
This EVAA Protocol price prediction begins with EVAA trading far higher after a sharp run from the $1 area. Readers can compare it with theearlier EVAA price analysis to see how the setup has changed.
How Far Has EVAA Run in the Last 24 Hours?
CoinMarketCap market data puts EVAA at $5.89, up 34.52% over 24h. The token ranks 255th by market cap.
Market cap stands at $105.23M. FDV, the value if every token were in circulation, reaches $294.78M.
Is $66.2M in 24h volume enough to back a 34.52% jump? It seemed light at first because that volume equals 62.45% of market cap, a heavy turnover for a token this size.
Does EVAA Holder Concentration Raise the Risk of a Sharp Drop?
BscScan holder data shows the top 100 wallets hold 99.52% of the tracked supply.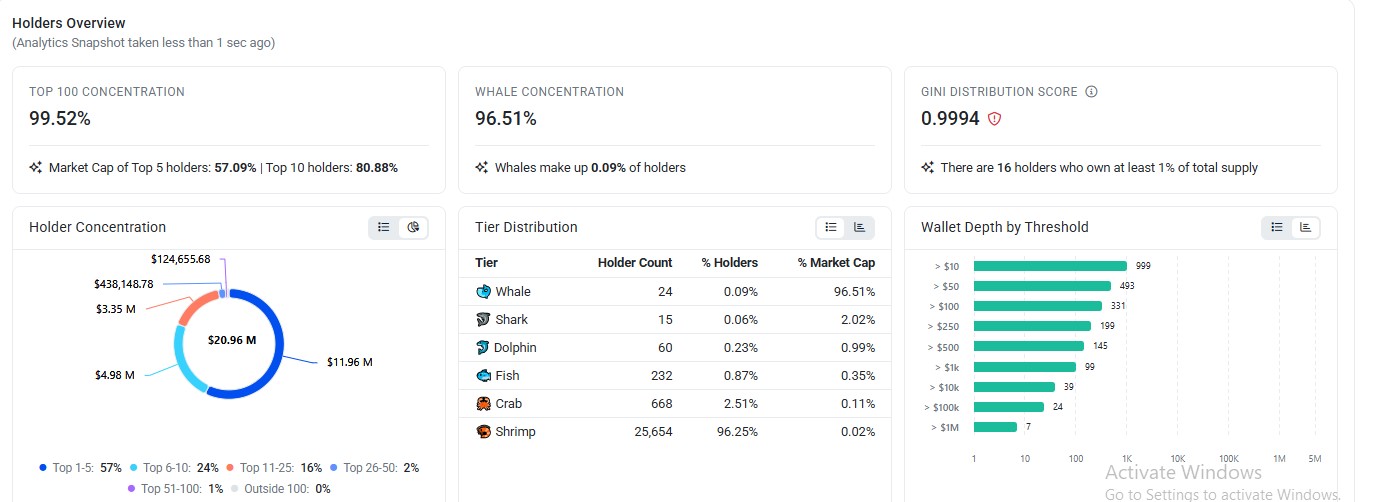
Source: BscScan, EVAA holder's overview, captured Nov 20, 2026, 11:24 UTC
The top 5 holders account for 57.09% and the top 10 for 80.88%. Whales, meaning very large wallets, number 24. They make up 0.09% of holders but hold 96.51%.
The tracker's $20.96M base doesn't match the $105.23M market cap from CoinMarketCap, so these shares work best as relative weights.
That level of holder concentration means one large transfer to an exchange could add sell pressure fast. The support level at $4.2564 would feel it first.
Is EVAA Liquidation Data Pointing to a Short Squeeze?
Window
Total liquidations
Longs
Shorts
1h
$240.76K
$596.79
$240.16K
4h
$382.28K
$18.55K
$363.73K
12h
$754.26K
$71.99K
$682.27K
24h
$1.86M
$121.31K
$1.74M
Source: CoinGlass, EVAA liquidations for 1h, 4h, 12h, and 24h, captured Nov 20, 2026, 11:24 UTC
CoinGlass futures data shows $1.86M in total EVAA liquidations over 24h. A liquidation is a forced exit from a borrowed-money trade once margin runs out.
Shorts lost $1.74M against $121.31K for longs over 24h, and the gap held in every window.
Each forced short exit is a buy order, so it adds buy pressure while it lasts. Once the shorts are cleared, then the rally needs fresh buyers.
EVAA Technical Analysis: MACD, EMA levels
The TradingView 4H chart of EVAA/USDT on KuCoin frames this EVAA Protocol price prediction. After days of flat trade near $1, buyers took control and drove a near-vertical climb.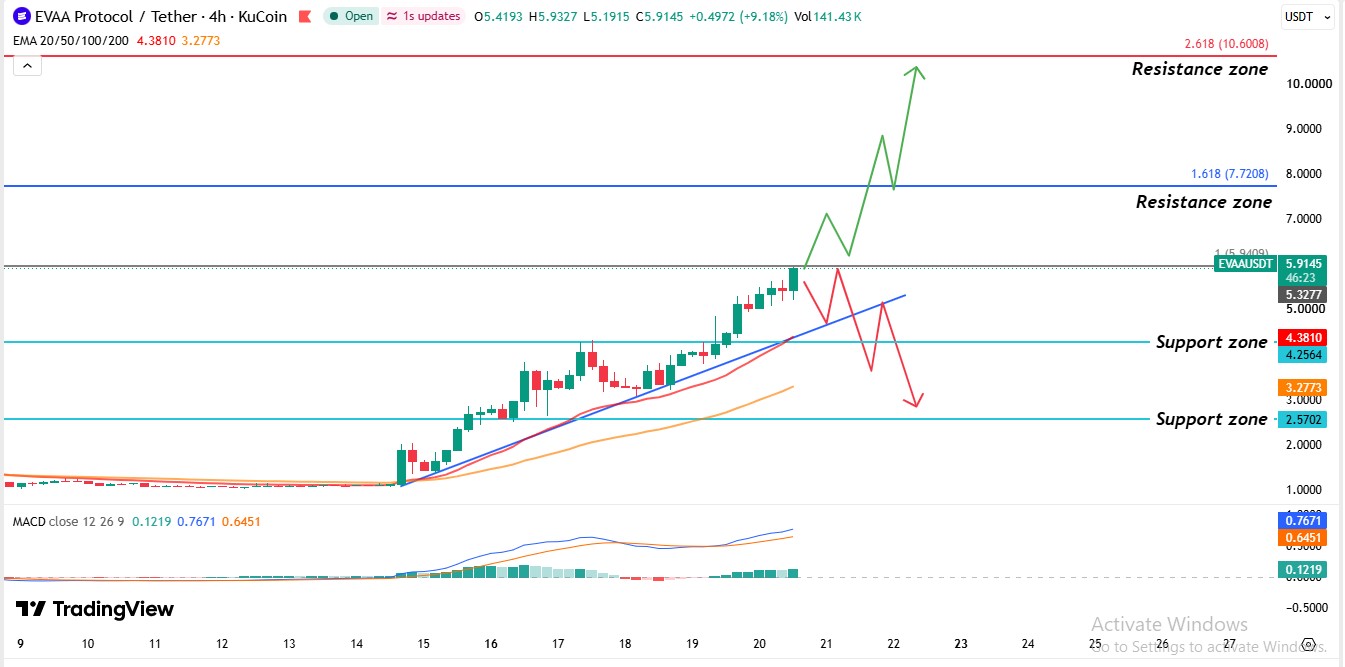
Source: TradingView, EVAA/USDT 4H, captured Nov 20, 2026, 11:24 UTC
The first leg stalled in a range, a band held between a support level at $2.57 and a resistance level at $4.2564. Dips found buyers, but the $4.2564 resistance level rejected the price at the top. Then buyers broke above it, and the role flip followed, with resistance turning into support.
The 20 EMA sits at $4.38, about 25.6% below the market price, and reacts fastest. The 50 EMA sits at $3.28, about 44.4% below, and reacts slower.
The price and the latest candle trade are above both, and both lines slope upward. A candle trading below the 20 EMA would be the first warning, with the $4.2564 support level right beneath it.
The chart's green path marks a push toward $7.72, while the red path marks a slide through the rising diagonal under the candles. Headlines fromcrypto news updates could also move a thin-float token fast. Right now, the price stands just under $5.94, well above the $4.2564 support level and both EMAs.
The EVAA MACD level reads 0.7671, with the signal line at 0.6451. MACD, moving average convergence divergence, is a momentum gauge built from two EMAs. Both lines sit above zero, and the histogram, the gap between them, reads 0.1219, so buyers hold the edge.
Support and Resistance Levels
Level
Type
$10.60
Resistance level
$7.72
Resistance level
$5.94
Resistance level
$4.38
20 EMA
$4.2564
Support level
$3.28
50 EMA
$2.57
Support level
EVAA Price Forecast: Bull, Base, and Bear Scenarios
Bull: A daily candle trading above $5.94 targets $7.72, then $10.60, then $10.60. A daily candle back below $5.94 cancels it, and short liquidations must keep feeding buyers.
Base: Price stays between $4.2564 and $5.94 in sideways trade, and a daily candle breaking either level ends the base case.
Bear: A daily candle trading below $4.2564 targets $2.57. A daily candle back above $4.2564 cancels it, and thin liquidity would make whale sales hit harder.
Risks start with concentration, since a few large wallets could sell into thin trade.
EVAA Protocol Price Prediction: Expert Outlook
As per CoinGabbar analysis, this EVAA Protocol price prediction leans bullish while the price holds above the $4.2564 support level.
And EVAA liquidation data shows shorts took most of the pain. But with the top 10 wallets holding 80.88%, one large sale could flip the move.
A daily candle trading below the 20 EMA, just above the $4.2564 support level, would be the first sign that the bullish read is failing.
Disclaimer: This article is for information only and isn't financial advice. Traders should do their own research and risk only what they can afford to lose.
