Falcon Finance price prediction (FF) trades at $0.1108 after a sharp +33.25% move in 24 hours as of September 2, 2026 UTC. Volume exploded past $94M. Market cap sits near $340M, based on curr
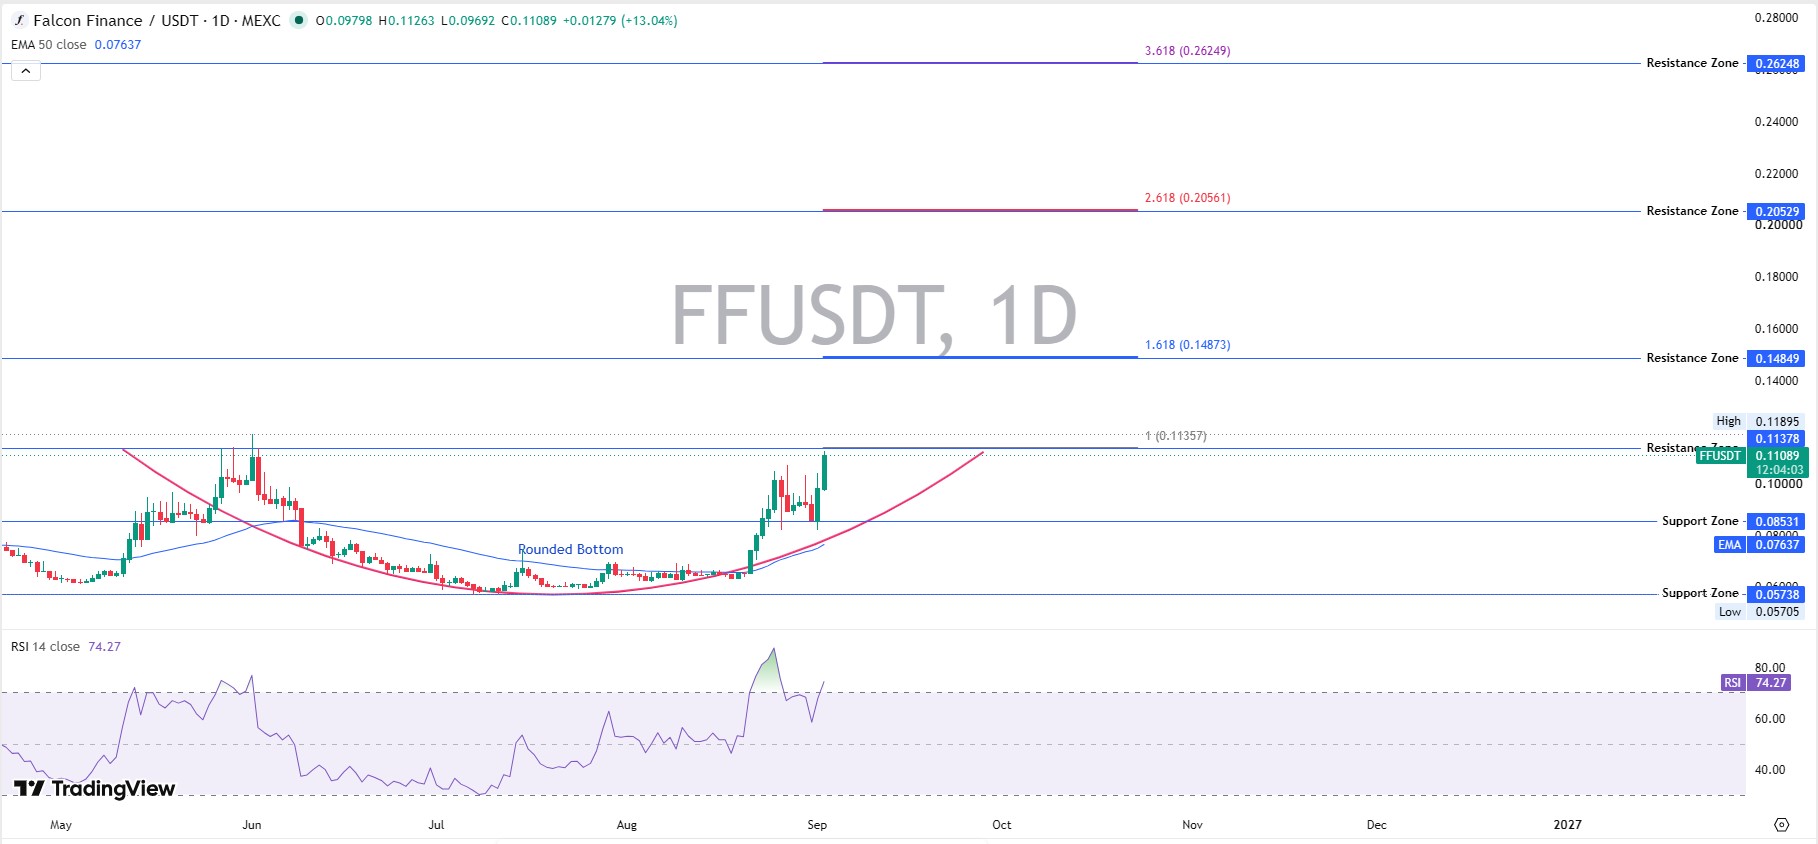
Falcon Finance price prediction (FF) trades at $0.1108 after a sharp +33.25% move in 24 hours as of September 2, 2026 UTC. Volume exploded past $94M. Market cap sits near $340M, based on currentFalcon Finance market data. The short-term trend flipped higher after a multi-month base. Immediate resistance clusters around 0.1138-0.1190. Key support holds near 0.0853. Daily RSI reads 74.27. The next upside target sits at the 1.618 extension near 0.1487. The main downside risk remains a loss of the 0.0853 zone.
Falcon Finance Price Prediction Today
$FF printed a strong session with high participation. Circulating supply stands at 3.06B against a 10B max. Fully diluted valuation sits near $1.1B. Sentiment turned risk-on for this name specifically, echoing broader shifts covered in recentaltcoin price forecasts.
The move arrived with a 726% volume spike. That matters more than the percentage gain alone. Traders chased the breakout from a prolonged consolidation range. Short-term structure now favors buyers as long as price holds above the breakout zone.
Here's the thing: volume confirmed the move. Without it the rally would look thinner.
FF Price Prediction: Key Levels to Watch
FF Resistance Levels
Immediate resistance sits at 0.1138-0.1190. A clean daily hold above 0.1190, visible on alive FF price chart, opens the path to the 1.618 Fibonacci extension at 0.1487.
Major resistance layers are higher at 0.2056 (2.618) and 0.2625 (3.618). Breakout confirmation needs sustained volume above the prior high. Thin volume on a push higher would raise questions about follow-through.
FF Support Levels
Immediate support rests at 0.0853. Stronger support sits near the EMA50 zone around 0.0764 and the deeper 0.0574 level.
A break below 0.0853 risks a pullback toward the lower support band. That would shift the short-term bias.
$FF Invalidation Level
The current bullish thesis loses force if daily trading settles below 0.0853 with rising volume. That level marks the structural floor from the recent base. A decisive break there would reopen the prior range and target the 0.057-0.076 area.
Falcon Finance Technical Analysis
FF Daily (1D) Chart Analysis
FF Weekly (1W) Chart Analysis
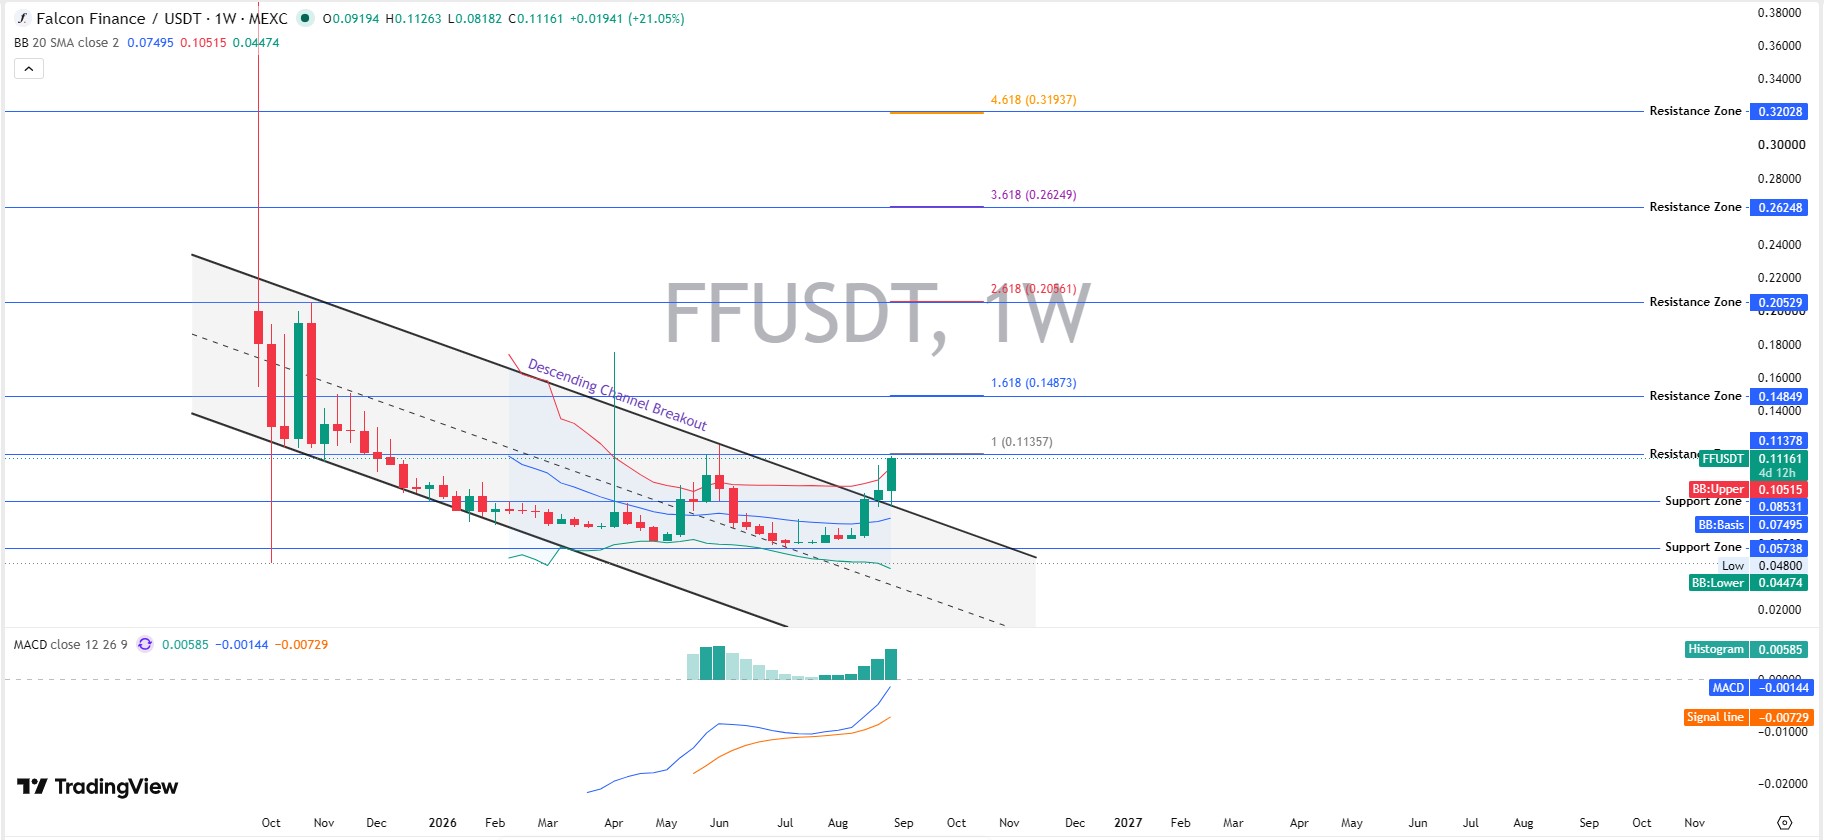
The weekly FFUSDT chart shows the price at 0.11093, up 20.31%, breaking above a multi-month descending channel that contained the trend since late 2025. This breakout signals a potential macro reversal. RSI14 reads a moderate 63.06, leaving room before overbought levels, unlike the daily chart. Resistance zones stack higher at 0.14849, 0.20529, 0.26248, and 0.31937, offering staged upside targets if the breakout confirms with volume.
FF Trend Analysis
Price structure shifted after a clear rounded bottom on the daily chart. Higher lows formed through August into early September. The weekly chart shows a descending channel breakout.
Moving averages turned supportive. The EMA50 now acts as dynamic support. Trendline resistance from the prior downtrend has been cleared.
FF RSI Analysis
Daily RSI closed near 74.27. That places momentum in overbought territory. Weekly RSI sits more moderate near 63.
Momentum remains strong but stretched on the lower timeframe. Overbought readings often appear during powerful breakouts. They do not automatically signal reversal.
$FF MACD Analysis
MACD shows a bullish crossover with an expanding histogram. The signal line trails the MACD line higher. Momentum confirmation arrived with the volume surge.
Turns out the histogram has been building for several sessions.
FF Volume Analysis
Volume is the key confirmation tool here. The 700%+ surge on the breakout day stands out, and positioning data onFF derivatives data shows elevated activity around the move. A breakout without volume rarely sustains. This one came with it.
Watch whether volume stays elevated on any retest of support. Falling volume on higher prices would weaken the setup.
Falcon Finance Price Prediction for 2026
Scenario
Potential Zone
Condition
Bear
0.055-0.075
Support breakdown
Base
0.12-0.16
Range continuation
Bull
0.20-0.26
Resistance + volume breakout
These zones derive from the current Fibonacci structure and channel measurements. They are not guarantees. For broader context, recentcrypto price predictions show similar range-bound setups across mid-cap tokens.
Falcon Finance Price Prediction 2027
Protocol growth around USDf and RWA collateral expansion will matter more than pure price action. Token utility tied to governance and incentives can support demand if adoption continues.
Market cycle conditions and any supply unlocks from team and investor cliffs will shape the path. Technical structure from the 2026 base would still influence intermediate swings. Avoid treating any single number as fixed.
Falcon Finance Price Prediction 2030
The conservative case assumes limited RWA traction and continued competition. Base case factors moderate ecosystem growth and stable collateral demand. Bull case requires sustained USDf expansion and broader tokenized asset adoption.
A $1 target would require roughly a $3.06B market cap at the current circulating supply. That remains a high bar relative to today's $340M valuation. Supply assumptions matter: max supply sits at 10B, as detailed in theFF tokenomics documentation. Unlock schedules for team and investor allocations introduce ongoing dilution risk.
What Could Drive $FF Higher?
Falcon Finance RWA Expansion
Falcon continues building regulated tokenization pipelines. GPU-related financing and broader real-world asset collateral form part of the stated roadmap. Progress here could expand the usable collateral base for USDf.
USDf Ecosystem Growth
USDf already exceeds $1B in supply according to recent transparency data, with on-chain activity traceable through theFF token contract. 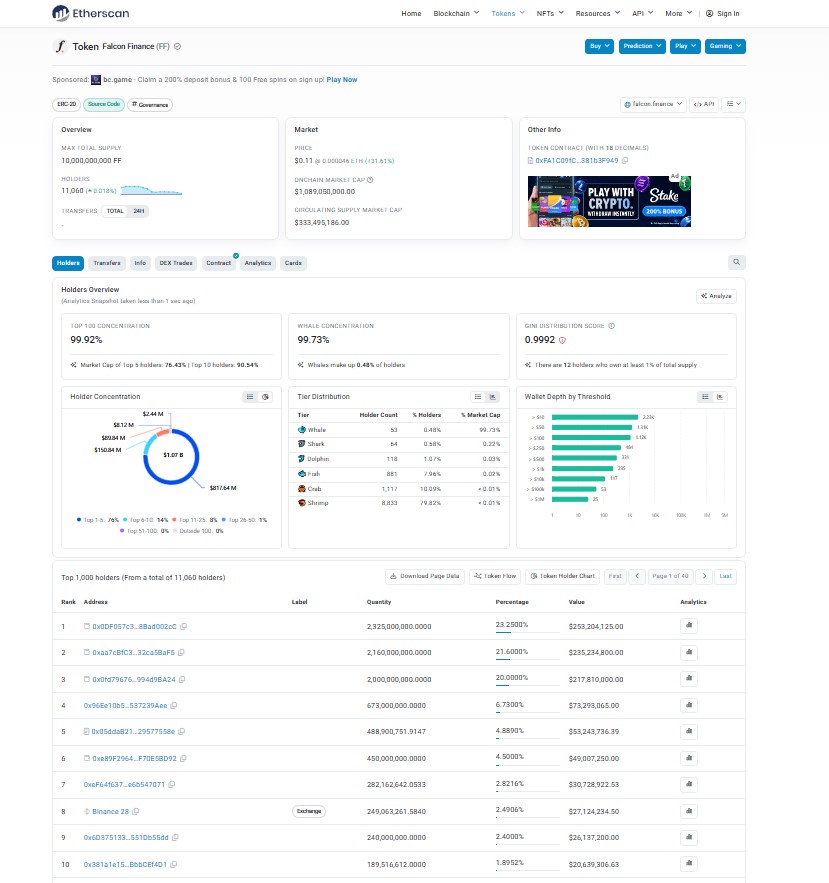
Growth in the synthetic-dollar product can increase demand for FF through governance and incentive mechanisms. Higher utility often supports token demand over time.
Exchange Liquidity and Adoption
Liquidity concentration on major venues, including Binance, remains solid. Continuednew exchange listings and deeper order books help absorb volatility. High relative volume during the recent move shows traders are engaged.
What Could Push Falcon Finance Lower?
Token unlocks from team and investor allocations create potential selling pressure once cliffs end. A broad crypto market downturn or sharp BTC decline, as tracked in ongoingBitcoin price coverage, would pressure alts. Loss of the 0.0853 support and falling volume would damage the technical picture.
RWA adoption missing expectations or rising competition from other synthetic-dollar and tokenized-deposit products adds risk. Regulatory shifts around real-world asset tokens remain a background concern.
FF Bull Case vs Base Case vs Bear Case
Bull Case: Resistance breaks with strong volume. BTC stays supportive. Positive Falcon ecosystem catalysts arrive. Supply pressure stays contained.
Base Case: Price trades a range. Adoption grows at a moderate pace. Market conditions stay mixed. No major positive or negative shock hits.
Bear Case: Support breaks. BTC weakens. Unlock-related selling appears. Volume fades. Sentiment turns negative.
Falcon Finance vs Bitcoin: Is FF Following the Market?
FF delivered a +33% session while Bitcoin traded mixed to lower over recent days, a divergence worth tracking throughlatest Bitcoin news. Relative strength favored FF during the breakout window.
Seven-day and thirty-day comparisons show FF outperforming the broader market on this specific move. Correlation often rises during risk-off periods. The current surge looks more name-specific than pure market beta.
When we pulled up the relative charts, the divergence stood out clearly.
Disclaimer: This article is for informational purposes only and does not constitute financial advice. Cryptocurrency markets are highly volatile. Always conduct your own research and consider your risk tolerance before trading.