FIL price map Resistance: $1.19-$1.23 First major support: $1.04-$1.09 Deeper support: $0.99-$1.01 Breakout evidence: a weekly close above $1.23, followed by a pullback that holds the area. F
FIL price map
Resistance: $1.19-$1.23First major support: $1.04-$1.09Deeper support: $0.99-$1.01Breakout evidence: a weekly close above $1.23, followed by a pullback that holds the area.
FIL traded near $1.18 on October 6, with the daily candle still open. The price remained below the September swing high of $1.2295, leaving the market inside the same range that has defined Filecoin’s recent attempts to recover.
$1.20 has already stopped Filecoin twice
The $1.19-$1.23 range carries more weight than a round number. On the weekly chart from TradingView, it failed to hold as support in January. Filecoin moved above it during the May rebound, but sellers soon forced the price back beneath the area.
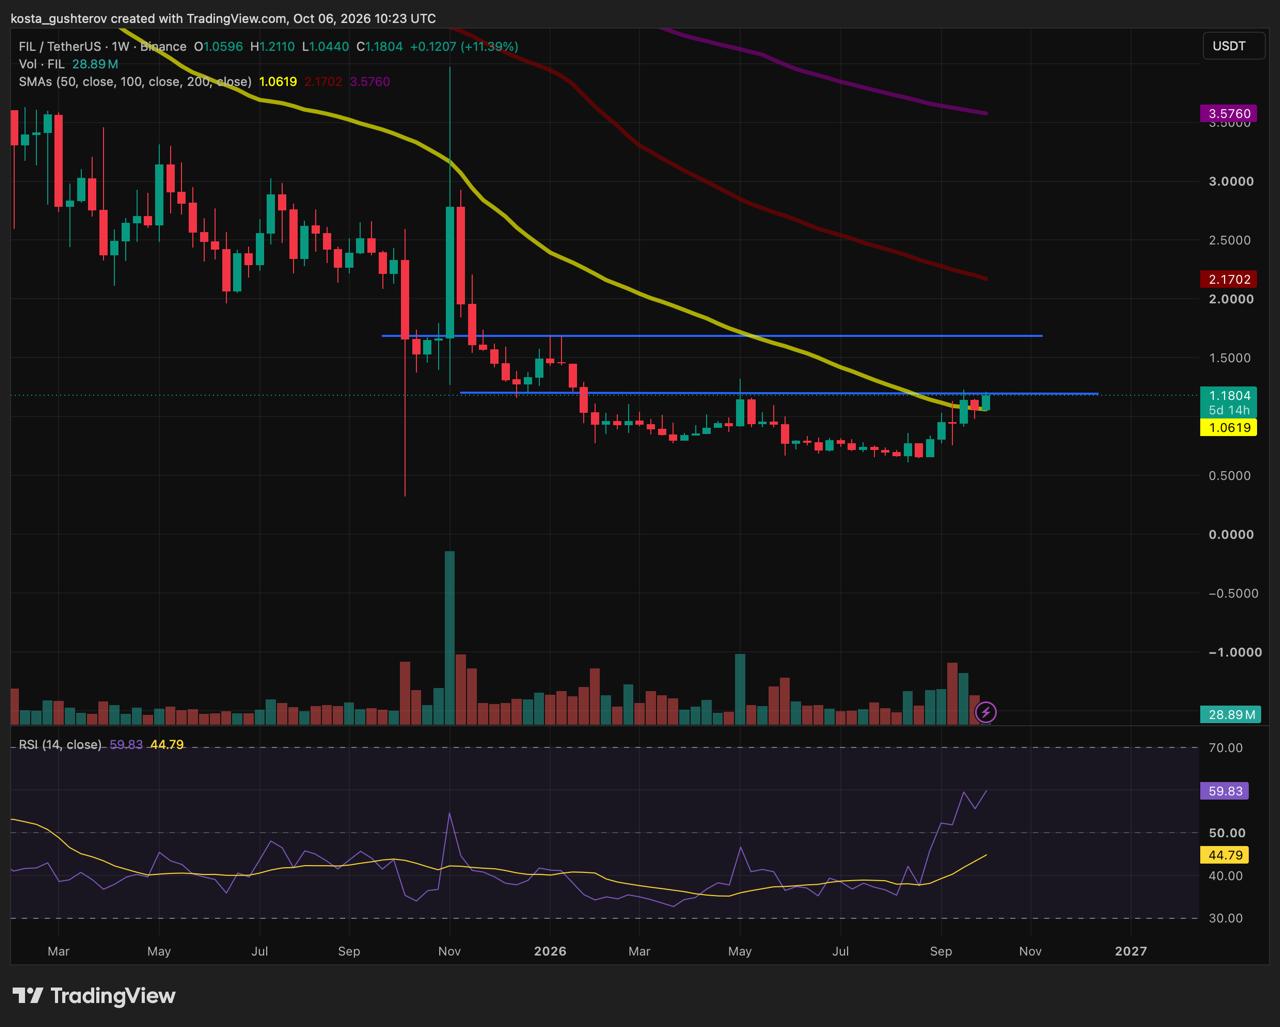
FIL weekly chart and resistance zone.
FIL has now returned to that level after several months of lower prices. That history leaves buyers with a clear task: they need to keep price above a zone where earlier rallies ran out of strength. Until that happens, the current advance remains a recovery approaching resistance rather than a confirmed move beyond it.
A weekly close above $1.23 would be the first sign that the market is treating the former ceiling differently. If price can return to the zone afterward and find buyers there, the May wick area around $1.30–$1.33 becomes the next reference. The larger weekly resistance near $1.65–$1.70 sits much further away and only comes into view after FIL establishes itself above $1.23.
The daily chart shows how FIL reached the test
Filecoin climbed from an August low near $0.6099 through a series of higher lows. Each pullback stopped above the previous one, allowing the price to rise within a developing ascending channel and eventually revisit the September high.
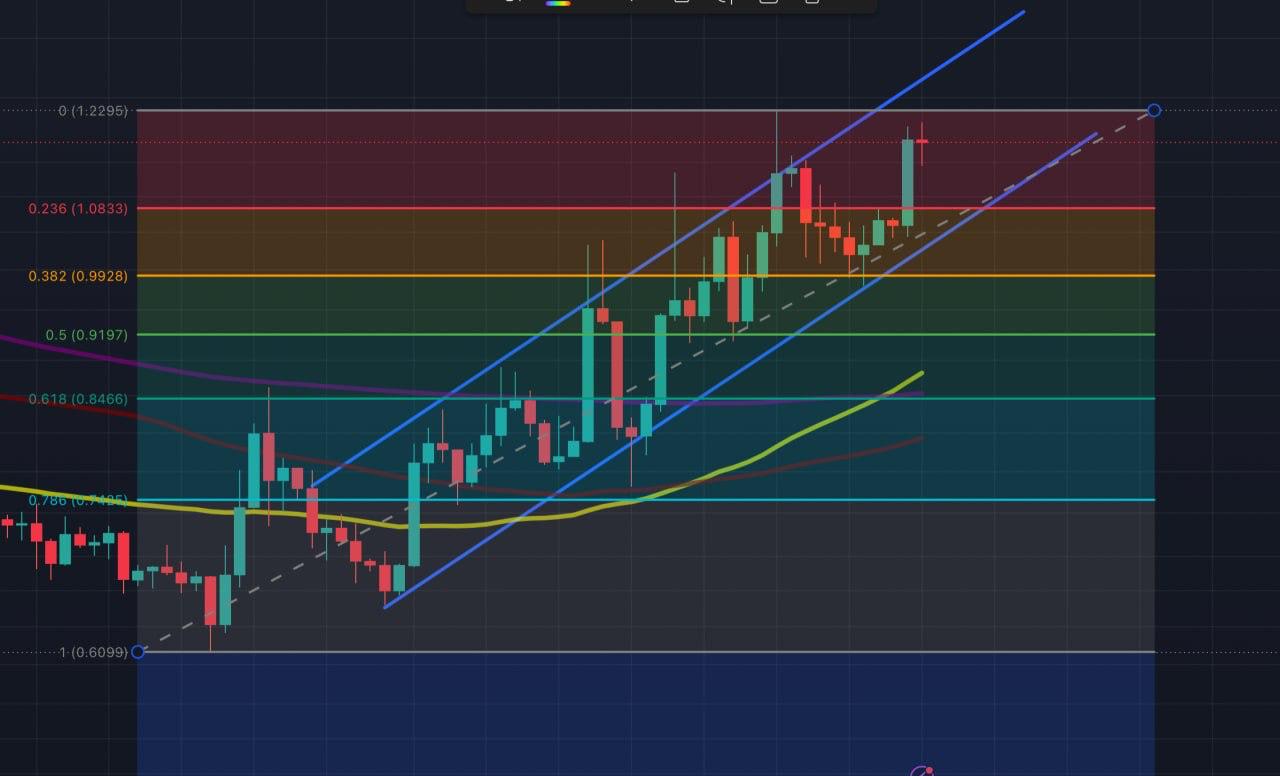
FIL daily chart and support zones.
The moving averages support that improvement. FIL trades above the 50-day SMA near $0.8754, the 100-day SMA around $0.8045 and the 200-day SMA near $0.8525. The 50-day average has started to rise, while the 200-day line still reflects the earlier downtrend. The chart has repaired considerably, though it has not yet erased the longer decline.
Daily RSI near 67.22, above its smoothing line around 62.07, also shows that buying momentum remains firm. It is close to the conventional overbought threshold of 70, which can accompany a strong rally but also makes the reaction at resistance more important. Fidelity’s RSI guide notes that overbought readings can persist during advances, rather than acting as an automatic sell signal.
A pullback has room without breaking the recovery
The rising lower boundary of the daily channel now approaches the $1.06–$1.07 area. It overlaps with the 0.236 Fibonacci retracement at $1.0833 and the weekly 50-SMA at $1.0619, creating the most important nearby support zone between $1.04 and $1.09.
$1.04-$1.09
The rising channel, 0.236 Fibonacci retracement and weekly 50-SMA meet in this area.
$0.99-$1.01
The 0.382 Fibonacci retracement at $0.9928 sits alongside the round $1 level and recent price reactions.
$0.91-$0.94
The 0.50 retracement at $0.9197 overlaps with September trading activity.
$0.84-$0.88
The 0.618 retracement at $0.8466 joins the 50-day and 200-day moving averages.
A brief move through the channel boundary would weaken the immediate pace of the rally. Losing the $1.04–$1.09 cluster would carry greater weight because it would place FIL below the channel, the weekly 50-SMA and the shallow Fibonacci retracement at the same time. The $0.99–$1.01 area would then become the next place where buyers need to show up.
That sequence also explains why the support should be treated as a range rather than a single price. Technical levels tend to attract orders across an area, particularly when several chart references sit close together. Support and resistance are therefore more useful as zones where the market’s reaction can be observed than as exact points where price must reverse.
READ MORE:
 US Treasury Withdraws Proposed Crypto Wallet and Mixer Rules
Volume and weekly momentum support the attempt
Several September advances arrived with noticeably stronger volume than the quieter trading that came before them. That supports the view that FIL’s recovery has attracted greater participation, although the current daily volume bar will remain incomplete until the session closes.
The weekly RSI, near 59.83 and above its smoothing line around 44.79, points in the same direction. Momentum has improved on both timeframes; price still needs to clear the obstacle in front of it. A rejection from $1.19–$1.23 would leave the daily recovery intact while it holds above $1.04–$1.09. A weekly close above $1.23 would show that Filecoin has finally moved beyond the level that ended the January and May attempts.
This article is for informational purposes only and does not constitute investment advice. Technical levels are approximate and do not guarantee future price movements.
The post Filecoin Price Returns to $1.20 After Two Failed Attempts appeared first on Coindoo.