What to Know FLR remains below the Bollinger mid-band as bearish pressure persists. RSI rebounded from oversold territory, signaling weakening selling momentum. Long-term projections suggest
What to Know
- FLR remains below the Bollinger mid-band as bearish pressure persists.
- RSI rebounded from oversold territory, signaling weakening selling momentum.
- Long-term projections suggest FLR could gradually recover toward $0.02 and beyond.
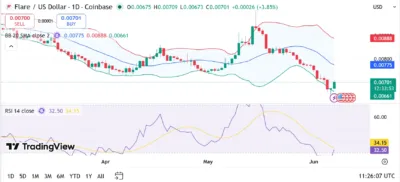
Flare (FLR) remains under pressure after an extended decline pushed the token toward its lowest levels in several months. The latest TradingView data shows FLR trading near $0.0070 on Coinbase, well below key resistance levels that controlled price action throughout May and early June.
Momentum indicators suggest sellers still hold the advantage, but signs of stabilization are beginning to emerge. The Relative Strength Index (RSI) has rebounded slightly from oversold territory, indicating that bearish momentum may be losing strength as buyers attempt to establish support near current levels.
The recent recovery candle has helped FLR move away from the lower Bollinger Band support zone. However, the broader trend remains bearish unless the token can reclaim important technical levels during the coming weeks.
Also Read: ChainGPT (CGPT) Price Prediction 2026–2030: Can CGPT Hit $0.10 Soon?
Market Structure and Price Action
FLR spent much of April and May moving within a broad consolidation range between $0.0073 and $0.0086. During this period, the Bollinger Bands remained relatively stable as buyers and sellers battled for market control. Market conditions changed sharply in late May when sellers gained momentum and triggered a sustained decline. Several consecutive bearish candles pushed FLR below the Bollinger mid-band near $0.00775, accelerating downside pressure across the market.
The sell-off eventually drove price toward the lower Bollinger Band around $0.00661. Buyers entered the market near this support level, helping FLR rebound modestly and recover back above the psychological $0.0070 area. Despite the latest bounce, FLR continues trading below the Bollinger mid-band, indicating that the market remains inside a short-term bearish structure.
Technical Analysis
Technically, FLR remains vulnerable while trading beneath the Bollinger mid-band resistance at approximately $0.00775. The lower Bollinger Band near $0.00661 currently serves as the most important support level. A breakdown below this zone could expose FLR to additional downside pressure and potentially trigger another wave of selling activity.
Meanwhile, the upper Bollinger Band sits near $0.00888 and represents the next major resistance area if buyers successfully reclaim the mid-band resistance. The RSI currently stands at 32.50, while its moving average sits near 34.15. This reading places FLR close to oversold territory and suggests that selling pressure may be approaching exhaustion.
Historically, RSI levels near 30 often precede relief rallies as bearish momentum weakens. However, stronger confirmation would require FLR to establish higher lows and reclaim resistance levels above the current trading range. Immediate resistance remains at $0.00775, while a sustained move above that level could open the path toward $0.00888 and potentially higher targets.
Source: Tradingview
Flare (FLR) Price Predictions (2026–2030)
YearMinimum PriceAverage PriceMaximum Price2026$0.0065$0.0095$0.01302027$0.0080$0.0125$0.01702028$0.0105$0.0165$0.02202029$0.0130$0.0210$0.02802030$0.0170$0.0270$0.0360
Yearly Insights
2026
FLR could remain volatile while attempting to build a base above the $0.0066 support zone and gradually recover toward $0.013.
2027
Improving network adoption and stronger crypto market sentiment may support a move toward the $0.017 region.
2028
A broader bullish market cycle could help FLR reclaim the $0.02 milestone and establish stronger long-term momentum.
2029
Continued ecosystem development and increasing utility across decentralized applications may drive sustained growth.
2030
Favorable market conditions could allow FLR to challenge the $0.03 region during an extended cryptocurrency bull market.
Conclusion
FLR is attempting to stabilize following a sharp decline that pushed the token close to oversold territory. While the broader trend remains bearish, the latest RSI recovery suggests that selling pressure may be beginning to weaken.
The $0.00661 support zone remains the most critical level to monitor in the short term. As long as buyers continue defending this area, FLR could build the foundation for a larger recovery.
A decisive move above the Bollinger mid-band at $0.00775 would significantly improve the technical outlook and increase the probability of a move toward $0.00888. Although risks remain elevated, the long-term outlook favors gradual appreciation if market conditions improve and adoption continues expanding.
FAQs
The nearest support level is located around $0.00661 near the lower Bollinger Band.
2. What is FLR’s main resistance level?
Immediate resistance sits near $0.00775 at the Bollinger mid-band.
3. What does the RSI indicate?
The RSI at 32.50 shows FLR remains near oversold territory, suggesting bearish momentum may be weakening.
4. Why is the Bollinger mid-band important?
The Bollinger mid-band often acts as dynamic resistance and helps determine the direction of the prevailing trend.
5. Can FLR reach $0.02 again?
Long-term projections suggest FLR could reclaim $0.02 if market sentiment improves and buyers successfully defend key support levels.
Also Read: Nexo (NEXO) Price Prediction 2026–2030: Can NEXO Hit $1.8 Soon?
The post Flare (FLR) Price Prediction 2026–2030: Can FLR Hit $0.02 Soon? appeared first on 36Crypto.