FLOKI Eyes Breakout, But A Retest Could Still Decide Everything Floki Inu started as a dog-themed meme coin riding the Shiba Inu wave, but it's since built real utility through NFT gaming, a
FLOKI Eyes Breakout, But A Retest Could Still Decide Everything
Floki Inu started as a dog-themed meme coin riding the Shiba Inu wave, but it's since built real utility through NFT gaming, a DeFi platform, and ongoing token burns.
That history is part of why this Floki price prediction July 2026 matters.
FLOKI has quietly been building toward a breakout after weeks of dead momentum.
Here's what the charts are showing right now.
What's FLOKI trading at right now?
FLOKI is sitting somewhere in the $0.0000220–$0.0000225 range, roughly flat to slightly green on the day after weeks of grinding lower.
Volume's nothing crazy, low single-digit millions across spot and futures combined, with MEXC and BingX handling most of the spot side while OKX carries the bulk of the futures activity.
Social sentiment trackers describe it as unusually quiet for a coin this size, and RSI is parked in the mid-40s, which is basically the market shrugging. No strong conviction either way yet.
How bad were the liquidations before this move?
Pretty one-sided, honestly.
Roughly $120.85K got liquidated over the last 24 hours, and almost none of it was shorts.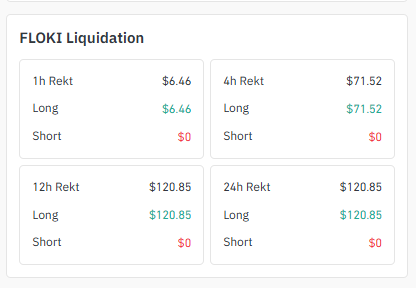 Source:Data Taken From Coinglass
Long liquidations dominated across every window from the 1-hour chart out to the full day. Shorts barely registered.
That tracks with the fake breakdown FLOKI printed right before the reversal.
Overleveraged longs got wiped during the dip while shorts sat there untouched. Once that flush was done, there just wasn't much resistance left when price pushed through the channel.
FLOKI likely stays bullish as long as $0.00002211 holds.
The 4-Hour Chart: A Triangle Resolves Upward
On the 4-hour timeframe, FLOKI was traveling inside a tightening range. It had been coiling into a symmetrical triangle, squeezed between a descending upper boundary and a rising support line underneath.
With the two converging somewhere around $0.00002207–$0.00002217.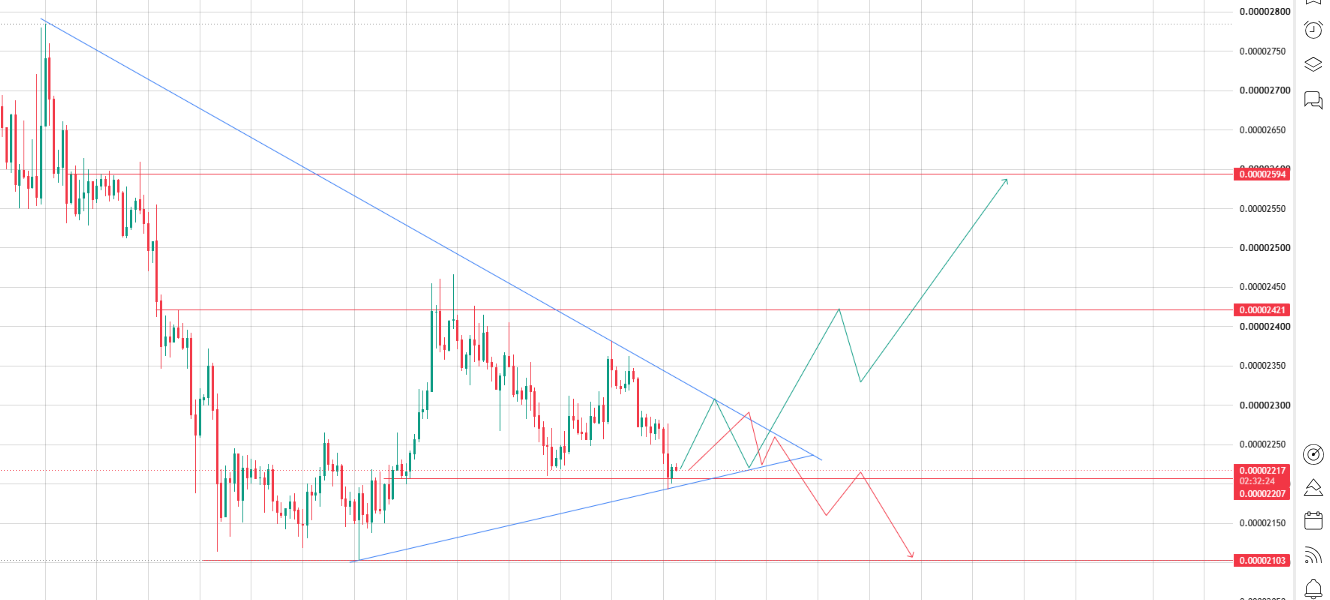
Source: Chart Taken From TradingView
That kind of tightening range usually resolves with a sharp move.
This time it broke upward, clearing $0.00002421, the upper boundary of the triangle that had turned back every rally attempt on this timeframe for weeks.
LevelPrice (USD)Significance
Resistance 20.00002594The next upside hurdle after a confirmed breakout.
Resistance 10.00002421Already cleared; now needs to hold as support on any retest.
Support 10.00002217 – 0.00002207The first key support zone below the current price.
Support 2 (Breakdown Level)0.00002103A move below this level would put the bullish outlook in serious doubt.
Here's how it plays out on either side of that triangle boundary. Price has broken above the $0.00002421 level and if it holds there on a retest.
That upper boundary flipping from resistance into support that confirms the breakout and opens the path toward $0.00002594.
If buying pressure keeps building beyond that, there's room to extend further still.
If, instead, that level gets rejected on the retest and the price falls back below $0.00002421, the setup weakens quickly.
From there, the first real cushion is support at $0.00002217–$0.00002207.
Should that level also give way, the price would likely head down to test $0.00002103; a break below that point would be a serious sign that the triangle breakout has failed and the broader downtrend is back in control.
Unless the retest gets rejected, the near-term bias leans bullish, with $0.00002594 as the next stop if momentum keeps building.
Daily Chart: Descending Channel Finally Breaks?
Zooming out, FLOKI spent weeks boxed inside a clean descending channel, a downtrend line capping every bounce on top, and a support shelf around $0.00002207–$0.00002211 doing the defending underneath.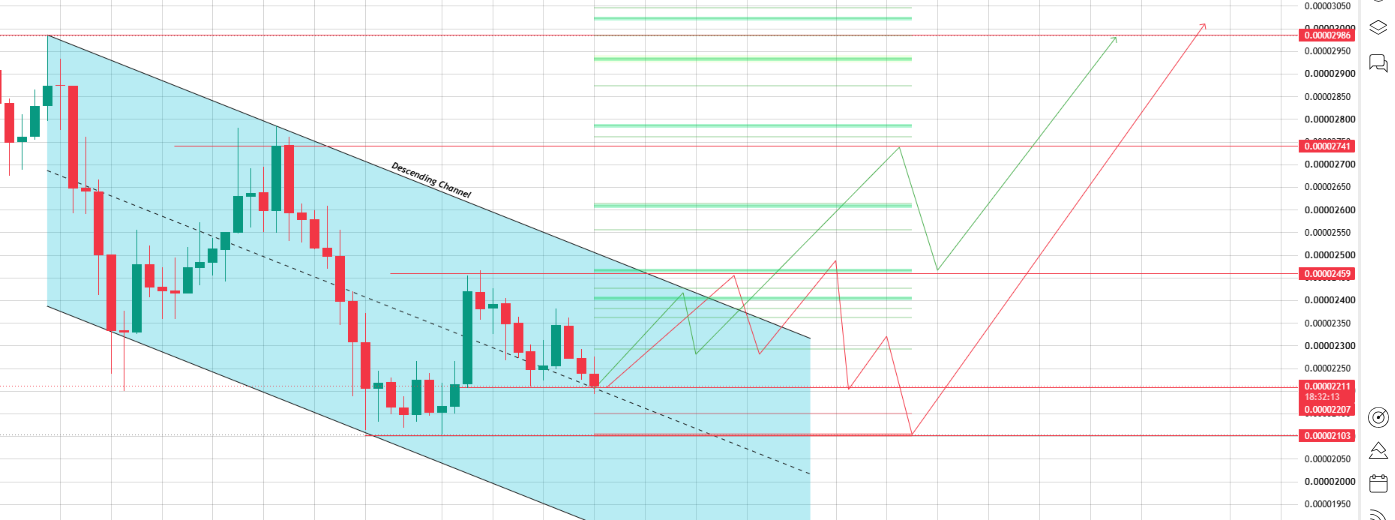
Source:Chart Taken From TradingView
LevelPrice (USD)Significance
Resistance 20.00002741The next major hurdle after the first breakout test.
Resistance 10.00002459Already broken; it now needs to hold as support on any retest.
Support 10.00002211A key support level where buyers have been actively defending.
Deep Support (Invalidation)0.00002103A break below this level would invalidate the current bullish structure.ScenarioKey LevelNext Target
Bullish Breakout ConfirmedClose and hold above $0.00002459Potential rally toward
$0.00002741.
Rejection at ResistanceFails to hold above $0.00002459Likely retest of the
$0.00002211 support zone.
Bulls Lose ControlBreaks below $0.00002103Risk of a deeper correction toward the
2026 lows.
The way to read this chart: for weeks, the descending channel's support shelf around $0.00002207–$0.00002211 kept catching every dip and bouncing price back up, while the downtrend line above kept capping every rally.
What just happened is the price finally broke out of that channel to the upside, clearing the downtrend line that had contained it for so long.
At $0.00002459, the old channel resistance is the level to watch. If price holds above it on a retest, that's confirmation the breakout is genuine, and the path toward $0.00002741 opens up naturally from there.
If price instead gets rejected at that same trendline and falls back inside the old channel, FLOKI likely revisits the $0.00002211 support zone that held the structure together for weeks.
That level would need to hold again to keep the bullish case alive.
A break below the deeper $0.00002103 level would be the point where the recovery story genuinely falls apart, opening the door to a deeper correction back toward the lows seen earlier in 2026.
So, FLOKI price prediction July 2026: What's actually next?
It really comes down to one thing: does the daily close hold above $0.00002459 or not?
Hold it, and $0.00002741 and then $0.00002986 are realistically in play.
Lose it, and $0.00002211 comes back into focus fast, with $0.00002103 as the level that flips this whole structure bearish again.
Bottom Line
FLOKI did something it hasn't managed in weeks; it actually broke above its own descending channel instead of getting sold right back into it.
The fake breakdown right before this wiped out a pile of overleveraged longs while barely touching shorts, and that's usually a decent sign the move has some real conviction behind it, not just a random wick.
Still, one green candle doesn't make a trend. $0.00002459 on the daily and $0.00002405 on the 4-hour; need to hold on for a retest or lose them, and this slides right back into the same grind FLOKI's been stuck in for months.
Hold them, and $0.00002741–$0.00002986 is a genuinely realistic near-term target. Watch the levels, not the hype.
Disclaimer: This article is for informational purposes only and should not be considered financial or investment advice. Cryptocurrency markets are highly volatile and unpredictable. Always do your own research and consult a licensed financial advisor before making any investment decisions. Past performance is not indicative of future results.