This Floki price prediction looks at $FLOKI trading at $0.00002385, boxed inside a falling channel just above its nearest support. It's one of the more heavily traded meme coins around, with
This Floki price prediction looks at $FLOKI trading at $0.00002385, boxed inside a falling channel just above its nearest support.
It's one of the more heavily traded meme coins around, with an ecosystem that goes beyond the token itself into FlokiFi, the Valhalla metaverse, and a handful of NFT games.
So where might it go from here? Let's look at what the liquidation data, exchange volume, and the charts are actually telling us.
FLOKI Liquidation Data: Longs Face Mounting Pressure
Floki Price Prediction Insight: Long positions have taken almost all of the recent losses here, while short sellers have barely felt a thing.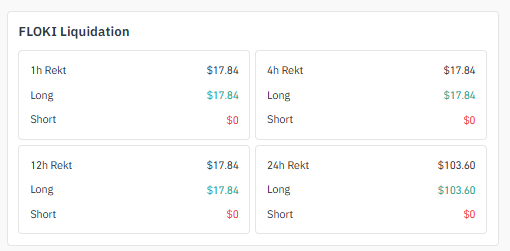
Source:Data taken from Coinglass
TimeframeTotal RektLongs LiquidatedShorts Liquidated
1 Hour$17.84$17.84$0
4 Hours$17.84$17.84$0
12 Hours$17.84$17.84$0
24 Hours$103.60$103.60$0
It's a pretty lopsided picture. Every dollar liquidated came from a long position; not a single short got wiped out, which suggests leveraged buyers kept getting caught on the wrong side during recent dips.
That said, these are small numbers in the grand scheme of things.
This looks like modest leverage activity around $FLOKI rather than any kind of major forced sell-off.
FLOKI Volume Heatmap: Where Is Trading Activity Now?
Here's where $FLOKI's trading volume is concentrated across exchanges at the moment: 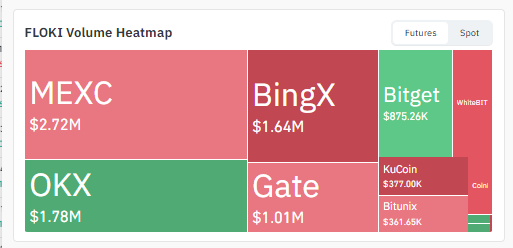
Source: Data taken from Coinglass
Exchange24H Volume
MEXC$2.72M
OKX$1.78M
BingX$1.64M
Gate$1.01M
Bitget$875.26K
KuCoin$377.00K
Bitunix$361.65K
MEXC is out in front by a decent margin, with OKX and BingX close behind.
Volume is spread fairly evenly across several mid-tier exchanges rather than piling up on one or two dominant order books, which points to broad-based interest rather than a single platform driving the action.
FLOKI 4-Hour Chart Analysis: A Short-Term RecoveryThe 4-hour chart tells a fairly clean pullback and recovery story.
Floki is currently trading at 0.00002385. The price fell hard from a local high near 0.00002779 down to a low around 0.00002117 and carved out a base between 0.00002117 and 0.00002254. 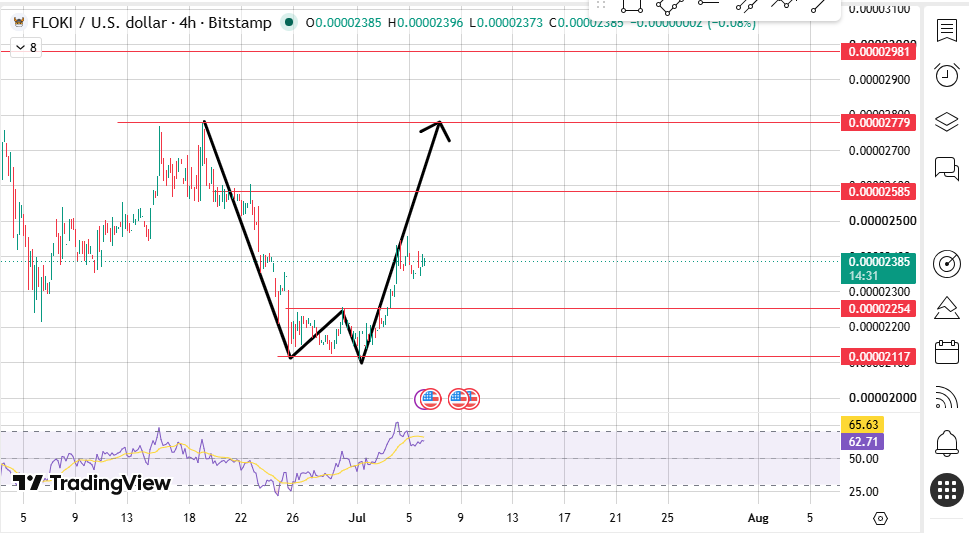
That's the shape of an early higher-low setup, with buyers stepping back in around the 0.00002117–0.00002254 zone. RSI at 62.71 and a moving average of 65.63.
Both lean bullish for now, though RSI is edging into territory where the move could pause or consolidate before it has another go at the 0.00002585–0.00002779 resistance cluster.
Floki Price Prediction Insight: The 4-hour structure still favors short-term bulls as long as the price holds above the 0.00002254–0.00002117 support band.
A break above 0.00002585 would be a good sign the recovery has real legs.
Level TypePrice (USD)
Resistance 30.00002981
Resistance 20.00002779
Resistance 10.00002585
Current Price0.00002385
Support 10.00002254
Support 20.00002117FLOKI 1-Day Chart Analysis: Inside the Falling Channel
Zoom out to the daily chart, though, and the tone gets more cautious. $FLOKI has been stuck inside a well-defined descending channel since early June, printing lower highs and lower lows the whole way down.
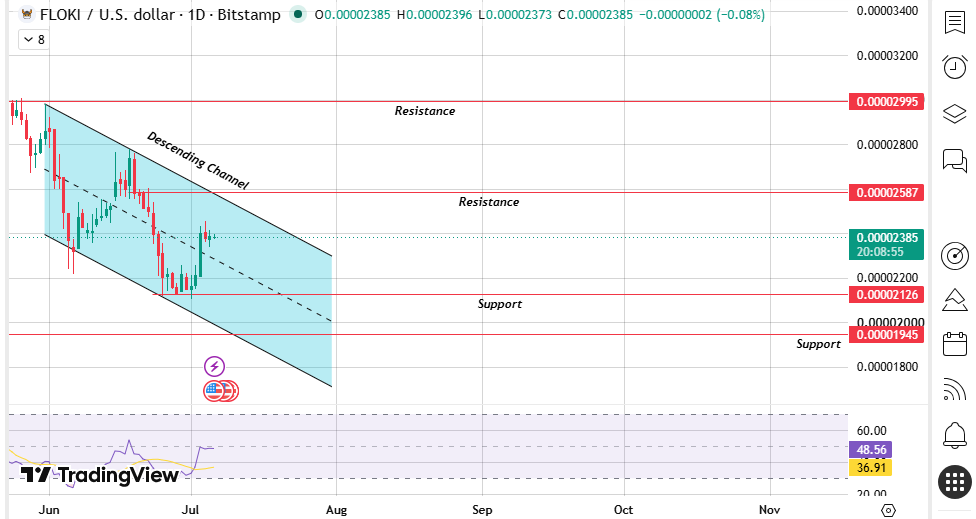
Price is currently parked just under the channel's midline, wedged between resistance at 0.00002587 and support at 0.00002126.
Daily RSI at 48.56 is about as neutral as it gets, while the moving average of 36.91 stays on the weaker side, which fits with the broader downtrend that's dominated the past month.
A daily close above 0.00002587 would be the first real evidence that FLOKI is trying to break out of this channel. Until that happens, the path of least resistance still points toward consolidation, or another test of level.
Level TypePrice (USD)
Resistance 20.00002995
Resistance 10.00002587
Current Price0.00002385
Support 10.00002126
Support 20.00001945FLOKI Price Prediction: Target TableScenarioTimeframeTarget Price (USD)Trigger Condition
Bearish TargetShort-Term0.00002117Loss of 4H support at 0.00002254
Bearish TargetMedium-Term0.00001945Daily close below 0.00002126
Base CaseShort-Term0.00002585Continuation of 4H recovery
Bullish TargetMedium-Term0.00002779Break above 0.00002587 daily resistance
Bullish TargetLong-Term0.00002995Confirmed breakout from descending channel
Bottom Line: Floki Price Prediction Outlook Today
Put the two time frames side by side, and FLOKI's near-term picture is mixed. On the smaller chart, short-term buyers appear to be back in the driver's seat, with price bouncing off the 0.00002117 support and RSI leaning bullish.
But zoom out, and $FLOKI is still trapped inside its daily descending channel, a structure that hasn't broken yet. For this bounce to turn into something more meaningful, buyers need to push price decisively past the 0.00002587 daily resistance.
Lose the 0.00002254–0.00002126 support zone instead, and the channel stays intact, with a retest of 0.00001945 becoming the more likely path.
Liquidation volumes are low and exchange activity is fairly moderate, so there's no sign of heavy speculative pressure pushing things one way or the other right now. How price reacts at these levels will likely decide which way it goes.
Disclaimer: This article is for informational purposes only and does not constitute financial, investment, or trading advice. Cryptocurrency markets, including FLOKI, are highly volatile and speculative. Chart patterns, support/resistance levels, and indicators discussed here are based on historical and technical data and do not guarantee future price movements. Always do your own research and consult a licensed financial advisor before making any investment decisions.