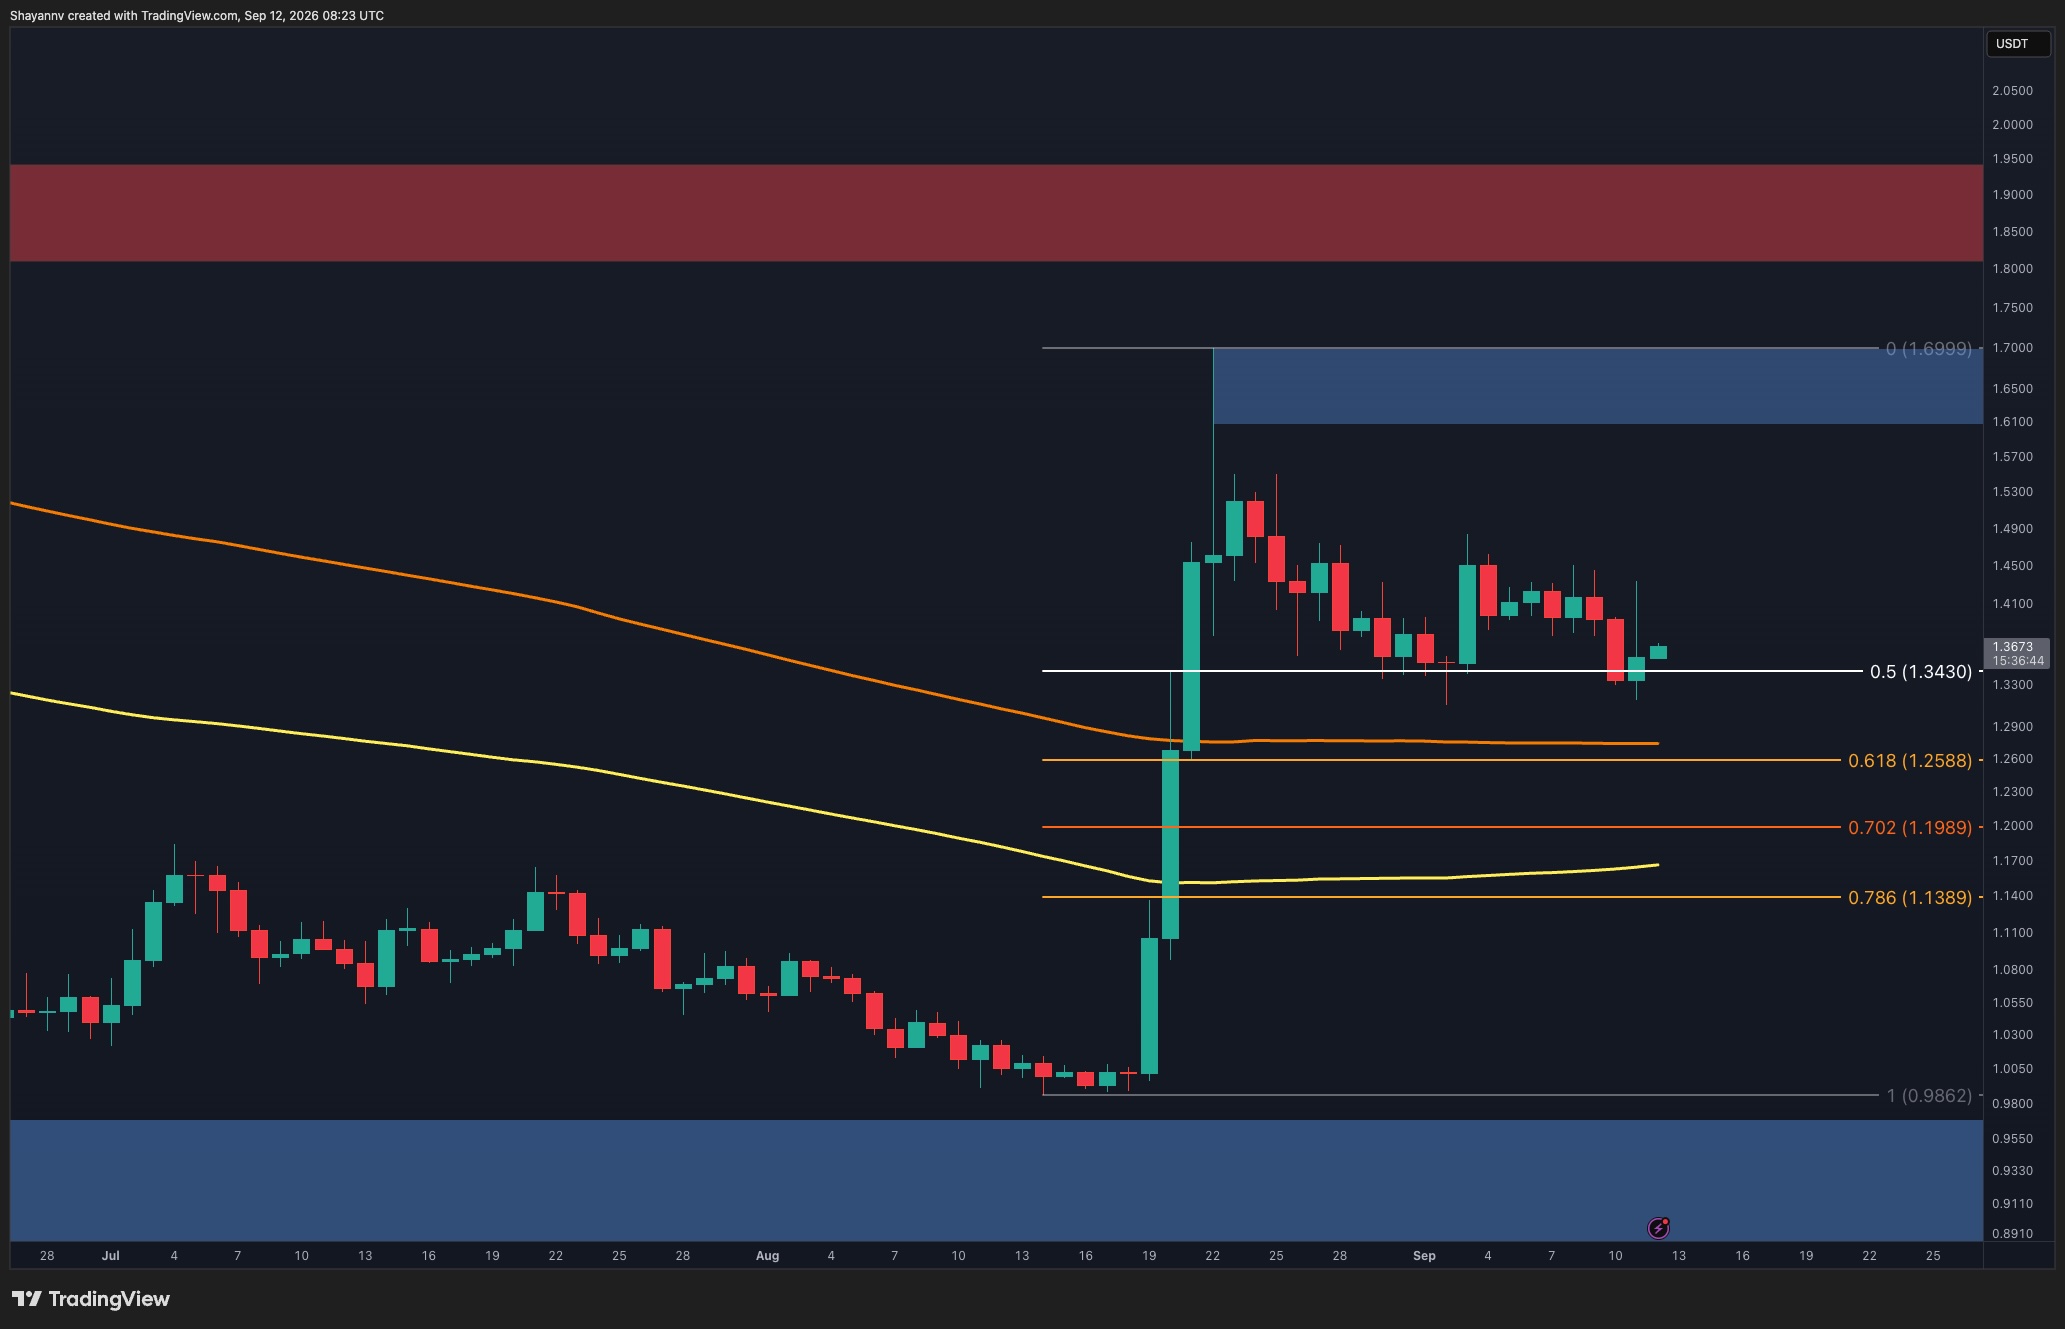
Fusionist (ACE) is staging one of its sharpest moves in months, surging more than 86% in the past 24 hours as it tests the upper edge of a long-term descending trendline on the weekly chart.
Fusionist (ACE) is staging one of its sharpest moves in months, surging more than 86% in the past 24 hours as it tests the upper edge of a long-term descending trendline on the weekly chart.
This Fusionist price prediction looks at what is driving the rally, why the weekly close matters more than the intraweek spike, and the levels traders are watching next.
The immediate spark came from Bitget, which confirmed on August 13, 2026, that its PoolX platform is now listing $ACE, letting users lock tokens to share a 110,000 ACE airdrop.
That announcement gave the rally a fresh headline, though it is only part of the story.
Why Is ACE Rallying Today?
TheBitget PoolX announcement provided a fresh catalyst and added visibility to $ACE, coinciding with the sharp rally as it unfolded.
It arrived alongside a rapid expansion in trading activity: 24-hour volume jumped roughly 449% to $75.74 million, pushing the volume-to-market-cap ratio above 326%, an unusually high level relative to $ACE's $21.41 million market capitalization.
That combination of a fresh catalyst and surging turnover added attention to an already developing breakout attempt.
Futures Traders Are Split Even as Shorts Get Squeezed
Futures data show the rally was fueled heavily by short covering rather than fresh long conviction alone.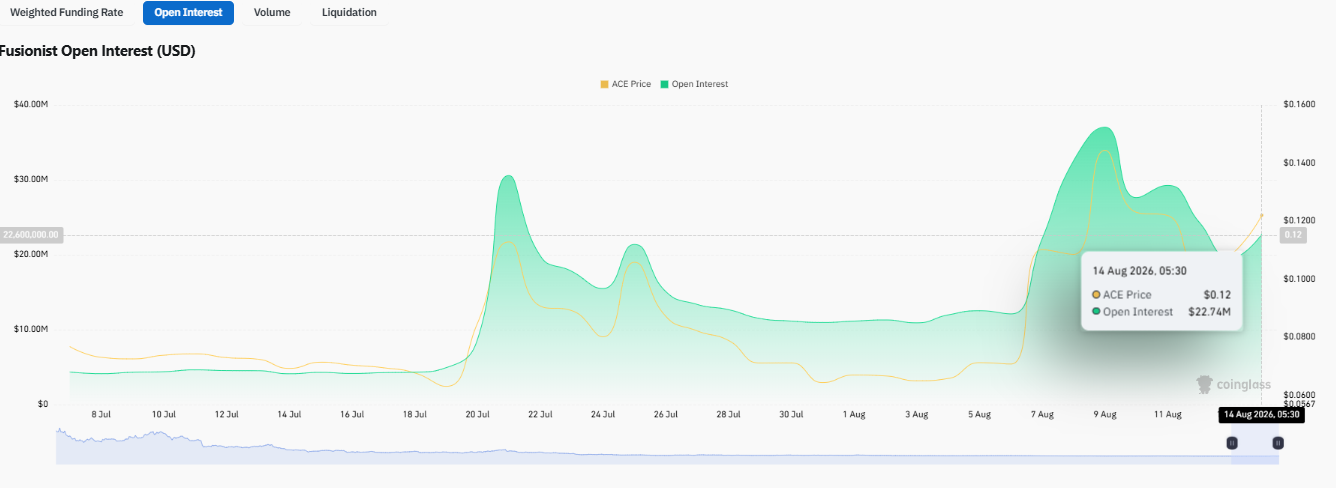
Open interest stood near $22.74 million as of August 14, and 24-hour liquidations totaled $1.01 million, with short positions accounting for $879.15K of that against just $129.20K in long liquidations, according toACE derivatives data from CoinGlass.
Shorter windows tell the same story, with 12-hour, 4-hour, and 1-hour liquidations all skewed heavily toward shorts.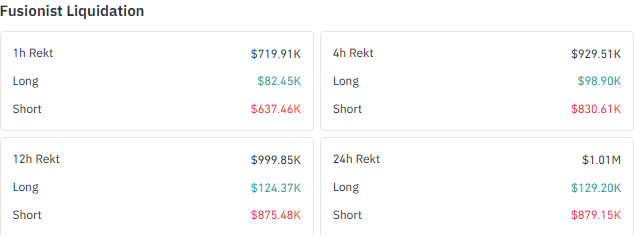
Yet positioning has not turned decisively bullish. Binance's long/short account ratio sits at 0.904 and the top trader account ratio at 0.7912, both still below parity, while top trader positions sit almost neutral at 1.001.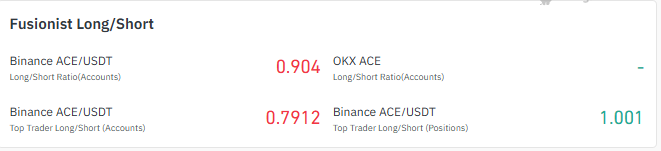
That mix suggests short covering forced part of the move, but broader trader sentiment has not fully flipped bullish.
$ACE is currently trading near $0.1989, according toACE market data on CoinMarketCap.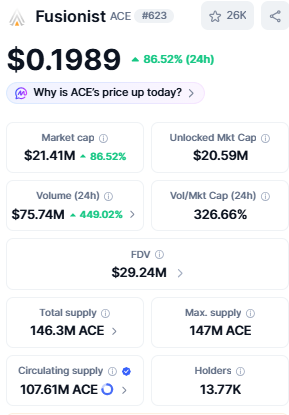
Fully diluted valuation stands at $29.24 million against an unlocked market cap of $20.59 million, with roughly 13.77K holders participating in the current move.
This burst follows an earlier recovery attempt from ACE's crash lowcovered previously on CoinGabbar, when Fusionist first began stabilizing from deeply oversold levels.
Weekly Chart Watch: Has ACE Escaped Its Downtrend?
The real story sits on theTradingView weekly chart, not the daily candles. $ACE opened the week near $0.12290, dipped to a low of $0.09551, and has since pushed as high as $0.21675, putting the weekly candle up at the time of writing.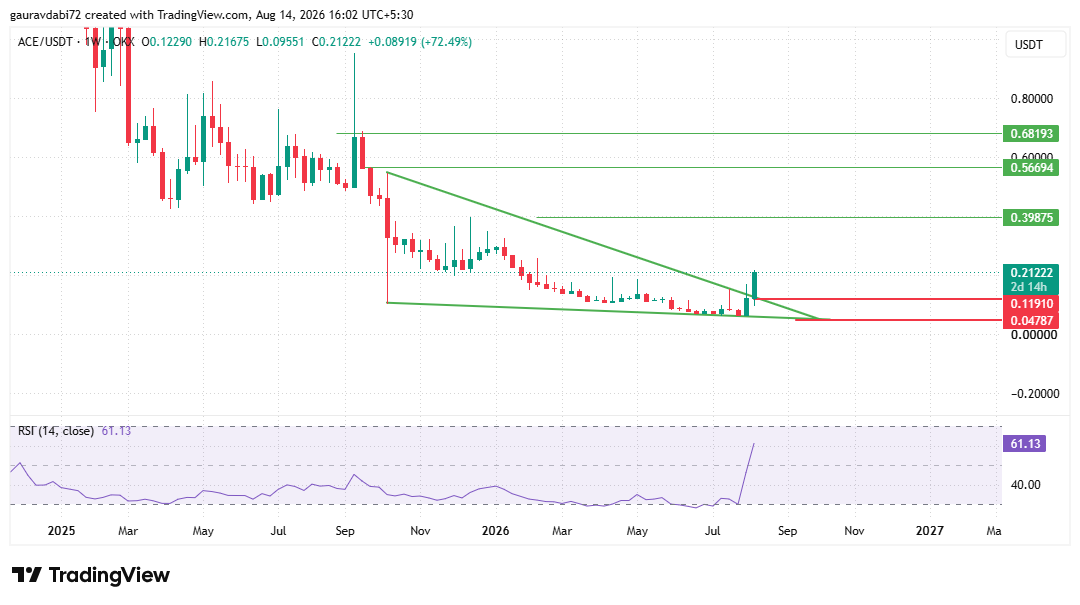
That move has carried price above the descending trendline that has capped $ACE for months, but the weekly candle is still open.
Until it closes above that trendline, this remains a breakout attempt rather than a confirmed breakout.
Weekly RSI has climbed to 61.13, above the neutral 50 mark and reflecting genuinely improving momentum, though it is nowhere near overbought territory.
A close that holds above the former trendline this week would meaningfully strengthen the case that ACE has turned a corner.
Fusionist Price Prediction: Conditional Scenarios for ACE
If ACE sustains this trendline break and the weekly candle closes above it, $0.39875 becomes the first resistance area to watch.
A convincing move beyond that level could open the door to $0.56694, with $0.68193 coming into play only if the recovery extends much further.
On the other hand, if ACE fails to hold the breakout and slips back inside its former descending structure, $0.11910 becomes the first important support/reference area.
A deeper breakdown below that point would put the deep structural support near $0.04787 back in focus, though that scenario would require substantially more technical deterioration than what is visible today.
This Fusionist price prediction leans on the weekly close, not the intraweek spike, as the deciding factor for which path plays out.
Can ACE Turn This Breakout Attempt Into a Trend Reversal?
As per the CoinGabbar analyst, the setup around ACE is unusual because the pieces do not all point in the same direction.
Price is up sharply, volume has expanded dramatically, and short sellers are being squeezed out.
At the same time, Binance's account-level long/short ratios remain below parity, showing that broader positioning has not caught up with the price move.
That gap between price action and positioning is why the weekly close carries more weight than the intraweek spike.
A close above the old trendline would align price with improving momentum, while a fade back below it would suggest the squeeze ran ahead of any genuine trend change.
What We're Watching Next
Traders following this Fusionist price prediction should watch three things this week: whether the weekly candle closes above the former descending trendline,
whether volume stays elevated after the PoolX headline fades, and whether Binance's long/short ratios move toward or above parity.
Any of these could confirm or undercut the current breakout attempt. For ongoing coverage, CoinGabbar'scrypto price prediction hub tracks these levels as the setup develops.
Disclaimer: This article is for informational purposes only and does not constitute financial, investment, or trading advice. Cryptocurrency markets are highly volatile, and prices can change rapidly. Readers should conduct their own research and consult a qualified financial advisor before making any investment decisions.