Author: CryptoOnchain Originally published on CryptoQuant Context & Ecosystem OverviewThree months after Gate.com launched real stock trading settled in USDT, the platform’s TradFi segment ha
Author: CryptoOnchainOriginally published on CryptoQuant
Context & Ecosystem OverviewThree months after Gate.com launched real stock trading settled in USDT, the platform’s TradFi segment has moved definitively past its initial “launch spike.” What we are witnessing now is sustained, compounding growth driven by sophisticated macro traders. According to the latest on-chain and exchange flow data analyzed by CryptoOnchain on CryptoQuant, Gate.com users are not just trading stocks—they are executing complex sectoral rotations.
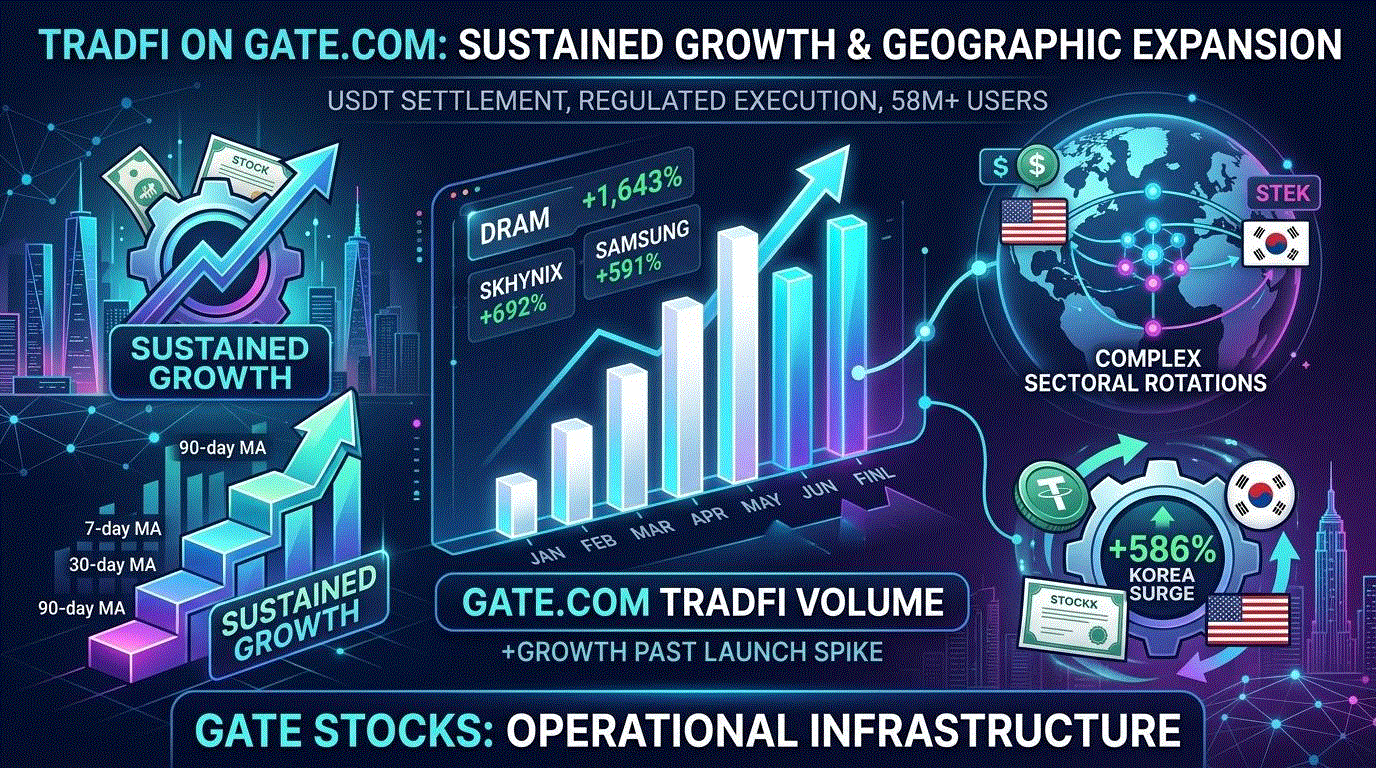
- The Compounding Volume LadderThe most reliable indicator of sustainable growth is a compounding moving average. As of late August 2026, Gate.com’s TradFi volume ladder shows a clear acceleration pattern:
90-day average: $320.4M/day30-day average: $386.4M/day7-day average: $436.8M/dayAugust has already booked $9.60B in volume with a week still left, officially surpassing July’s total ($8.30B) and tracking steadily toward the March all-time high.

aption: Figure 1 - Gate.com Monthly TradFi Volume and Platform Share. Notice how TradFi maintains its 2.72% platform share even during a massive crypto volume surge.
More impressively, this growth isn’t cannibalizing the platform’s crypto flow. Over the past week, Gate.com’s Spot and Futures volumes exploded by +245% and +127%, respectively. Mechanically, this should have crushed the TradFi sector’s relative market share. Instead, Gate Stocks maintained a 2.72% share of total platform volume—well above its 6-month historical baseline of 2.42%. Both engines are firing simultaneously.
- The Great Semiconductor RotationThe real alpha lies in what users are trading. We are observing a massive, highly intelligent capital rotation within the tech and semiconductor sectors.
Capital is heavily rotating out of crowded, high-beta AI darlings and legacy tech. Tickers like NVDAX (-86% 30v30 growth), INTC (-81%), and TSLAX (-59%) have seen significant outflows.
Where is that liquidity going? Directly into memory chips, space tech, and Asian semiconductor giants:
DRAM: +1,643%SK Hynix (SKHYNIX): +692%SanDisk (SNDK): +647% (Now processing a staggering $1.54B/day)Samsung: +591%SpaceX (SPCX): +449%

Geographic Distribution and Ticker Rotation. Capital is clearly shifting from crowded US mega-caps into Korean semiconductor giants.
- The Geographic Engine: Korea AwakensThis semiconductor rotation perfectly mirrors the geographic shift in Gate.com’s volume. While the US market still commands the lion’s share of cumulative volume ($62.6B, 81.3% share), the Korean market is the new growth engine.
Fuelled by the trading frenzy in SK Hynix and Samsung, the Korean equity book on Gate.com has surged by +586% over the last 30 days, processing over $14.4B in cumulative volume. By adding a second highly liquid trading session, Gate.com has effectively extended its equity coverage across critical time zones.
ConclusionGate.com’s TradFi segment is no longer a novelty bolted onto a crypto exchange. With USDT settlement, regulated broker execution, and seamless multi-market access (US + Korea) inside a single ecosystem of 58M+ users, it has evolved into operational infrastructure. The users aren’t gambling; they are allocating capital like seasoned macro funds.